Download
1 / 17
170 likes | 245 Views
Learn about phase separation in binary mixtures, phase diagrams, interaction energy, entropy, ideal and non-ideal mixtures, and phase separation in liquid and solid mixtures. Discover the impact of mixing different substances and the key role of free energy in determining equilibrium states.

E N D
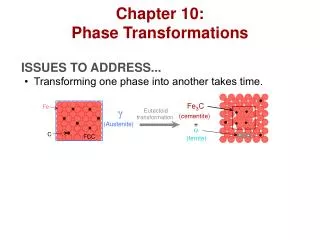
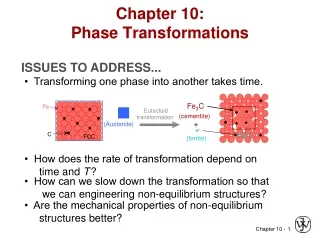
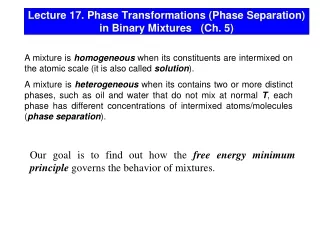
Lecture 17. Phase Transformations (Phase Separation) in Binary Mixtures (Ch. 5) A mixture is homogeneous when its constituents are intermixed on the atomic scale (it is also called solution). A mixture is heterogeneous when its contains two or more distinct phases, such as oil and water that do not mix at normal T, each phase has different concentrations of intermixed atoms/molecules (phase separation). Our goal is to find out how the free energy minimum principle governs the behavior of mixtures.
Phase diagram of a binary mixture Binary Mixtures T A simplified picture: (a)binary mixtures. The phase diagram for such a system has an extra dimension – x. (b) mixing occurs at fixed T,P within a fixed volume V. In this case, it does not matter which free energy we minimize - both F and G work equally well. x P P = const planes Boundary between different phases - a mixture will seek the state of equilibrium by minimizing this combination of its internal energy and entropy. We need to analyze both terms.
Interaction Energy in Binary Mixtures Let’s assume that the mixture is in a solid state, both species share the same lattice structure. Consider NA atoms of species A and NB=N-NA atoms of species B (x =NB/N). Each atom has p nearest neighbors. Let uAA, uAB, uBB represent the bond energy between A-A,A-B, and B-B pairs, respectively. On the average, an A atom is involved in p(1-x) interactions of A-A type and px interactions of A-B type. The average interaction energy per A atom: The average interaction energy per B atom: The total interaction energy: (the factor ½ corrects the fact that each bond has to be counted just once) The overall shape of U(x) depends on the interactions between different species: U 0 1 x
Ideal and Non-Ideal Mixtures Idealmixtures – the molecules A and B are of the same size and interactions A-A,A-B, and B-B are identical (uAA=uAB=uBB=u ): U Ideal mixture 0 1 x - does not depend on x In real (non-ideal ) mixtures of liquids and solids, the interactions A-A, A-B, and B-B might be very different (e.g., the water and oil molecules: water molecules carry a large dipole moment that leads to a strong electrostatic attraction between water molecules; in oil molecules this dipole moment is lacking). To be specific, we’ll consider the case of a non-ideal mixture when unlike molecules are less attracted to each other than are like molecules (uAB > uAA=uBB). Mixing of the two substances increases the total energy. (Note the sign of u: it’s negative for attraction) U 0 1 x As we’ll see, the fact that U has an upward bulge will have important consequences for phase separation in this mixture.
Entropy of a Binary Mixture The total number of ways of distributing the two species of atoms over the lattice sites: S The same result we get by considering the entropy of mixing for a system of two ideal gases (Pr. 2.37). Initially, gas A occupies portion (1-x) of the total volume, gas B – portion x. When the partition is removed, molecules A and B are intermixed over the whole volume: concave-downward function 1 0 x pure A pure B the slope is infinite at both ends, and therefore the entropy of mixing is going to be the dominant factor near x=0 and x=1. Similarly, for gas B: The total entropy increase upon mixing:
Ideal Mixtures, U U(x) F Free Energy of Mixtures T1 < - we assume that the process of mixing occurs at fixed T, P within a fixed volume V T2 0 1 x Non-Ideal Mixtures U = U(x) U 0 1 x As a result, in non-ideal mixtures with U(x) like on the plot, at T<TC, there is an upward bulge in the mid range of x which suggests instability. -S 0 1 x T<TC F At high temperature, S dominates! T>TC x1 x2 0 1 x
T<TC F T>TC F x1 x2 0 1 x T increases x1 x2 Phase Separation in Liquid and Solid Mixtures T<TC, two minima in free energy function unstable against macroscopic phase separation A mixture exhibits a solubility gap when the combined free energies of two separate (spatially separated) phases is lower than the free energy of the homogeneous mixture. The miscibility (solubility) gap emerges at TC and widens as the temperatures is decreased (for this specific type of interactions). Any homogeneous mixture in the composition range x1 < x < x2is unstable with respect to formation of two separate phases of compositions x1 and x2. xhomo Not all binary mixtures have this type of phase diagram. Some have an inverted phase diagram with a lower critical temperature, some have a closed phase diagram with both upper and lower TC.
T<TC F Chemical Potential of Mixtures The primary thermodynamic variables: x, T, and = (F/x)T,V. The variable x plays the same role for mixing that V plays for liquid-gas systems, while plays the role that pressure plays for liquid-gas systems. x1 x2 1 0 x The discussion of phase separation in the mixture is very similar to our analysis of the liquid-gas separation in the vdW model (see Lec. 15). The chemical potential curve (x) looks like the curve (n) for thevdW gas. 0 x1 x2 1 x T homogeneous mixture (single liquid or solid phase) There is a region of instability: TC In the outer regions of meta-stability, droplets rich of one species have to be formed in a sea of the phase rich in the other majority species, but the interface cost poses a free energy barrier which the droplets have to overcome for further growth. unstable heterogeneous mixture (two separate liquid or solid phases) metastable metastable x x2(T) x1(T)
Liquid 3He-4He Mixtures at Low Temperatures Mixtures of two helium isotopes 3He and 4He are used in dilution refrigerators. Also, it is a very interesting model system for various phase transitions (e.g., there is a so-called tricritical point on the phase diagram at which the lambda transition and the phase separation line meet). The 3He-4He mixture has a solubility gap. The energy of mixing must be positive to have a solubility gap. The origin of the positive mixing energy is quantum-statistics-related. lambda transition phase separation 3He atoms are fermions,4He atoms – bosons. 4He atoms occupy at low T the ground state with zero kinetic energy (“heavy vacuum” for 3He atoms). Almost the entire kinetic energy of the mixture is due to 3He atoms. The kinetic energy per atom of a degenerate Fermi gas increases with concentration as n 2/3. On the other hand, due to its smaller mass, a 3He atom exhibits a larger zero-point motion than a 4He atom. As a result, a 3He atom will approach 4He atoms closer than it would approach 3He atoms, and, consequently, its binding to a 4He atom is stronger than a 3He - 3He bond. Because of the competition between K and U, the effective binding energy vanishes at a 3He concentration of 6.5% for T=0, and no further 3He can be dissolved in 4He.
Tb2 Tb1 TA and TB – the boiling temperatures of substances A and B . Phase Changes of a Miscible Mixture At T > max(TA,TB), Ggas (x)<Gliq (x) for any x. With decreasing T, Ggas (x) increasesfasterthan Gliq (x) because of the –TS term. At T < min(TA,TB), Ggas (x) > Gliq (x) for any x. The T-x phase diagram has a cigar-shaped region where the phase separation occurs. This shaded region is a sort of non-physical “hole” in the diagram – at each T, only points at the boundary of this region are physical points. If we heat up a binary mixture (we move up along the red line), the mixture starts boiling at T = Tb1, the liquid and gas phases will coexist in equilibrium until T is increased up to T = Tb2 , and only above Tb2, the whole system will be in the gas phase. Thus, such a mixture doesn’t have a single boiling temperature. By varying T within the interval Tb1 < T < Tb2, we vary the equilibrium concentration of components in gas and liquid. The upper curve in the diagram is called the dew-point curve (the saturated vapor starts to condense), while the lower one is called the bubble-point curve. A - less volatile substance B - more volatile substance
T0 T* T1 A B Problem: The phase diagram of a solution of B in A, at a pressure of 1 bar, is shown in the Figure. The upper bounding curve (the dew-point curve) of the two-phase region can be represented by The lower bounding curve (the bubble-point curve) can be represented by A beaker containing equal mole numbers of A and B is brought to its boiling temperature at the bubble-point curve. What is the composition of the vapor as it first begins to boil off? Does boiling tend to increase or decrease the mole fraction of B in the remaining liquid? - boiling tend to decrease the mole fraction of B in the remaining liquid
Liquefaction of Air Air - mixture of oxygen (~21%) and nitrogen (~79%). At P = 1 bar, TN2 = 77.4 K and TO2 = 90.2 K. In the beginning of liquefaction at T = 81.6K, the liquid contains ~ 48% of oxygen. With decreasing T, the O2 concentration in liquid decreases from 48% to 21%, while in gas – from 21% to 7%. With increasing pressure, the character of this phase diagram changes. Above P = 33.5 bar, the critical pressure for N2, the distinction between pure N2 gas and pure N2 liquid vanishes – the left end of the “cigar” moves to the right. Above the critical pressure for one of the components, the phase separation occurs only within the shaded region. T (K) 0 1 x pure O2 pure N2
The Lever Rule Pr. 5.62: Consider a completely miscible two-component system, the overall concentration of phase B is x. The temperature is fixed within the interval where gas and liquid phases coexist. What is the proportion of the gas phase to liquid phase? At some T within the interval Tb1 < T < Tb2, the concentration of phase B in gas is xgas, in liquid - xliq. If the total number of molecules in the gas phase is Ngas and in liquid - Nliq, then The ratio of the total # of molecules in gas to the total # of molecules in liquid is the ratio of the lengths of the red and blue segments. xgas xliq x
Physics of Distillation This difference between liquid and vapor compositions is the basis for distillation - a process in which a liquid or vapor mixture of two or more substances is separated into its component fractions of desired purity, by the application and removal of heat. In this example, component B is more volatile and therefore has a lower boiling point than A. For example, when a sub-cooled liquid with mole fraction of B=0.4 (point A) is heated, its concentration remains constant until it reaches the bubble-point (point B), when it starts to boil. The vapor evolved during the boiling has the equilibrium composition given by point C, approximately 0.8 mole fraction B. This is approximately 50% richer in Bthan the original liquid. By extracting vapor which is enriched with a more volatile component, condensing the vapor, and repeating the process several times, one can get an almost pure substance (though most of the substance will be wasted in the purification process). pure B pure A
G gas More Complicated Phase Diagrams Sometimes interactions between the molecules distort the phase diagram. If the liquid’s free energy is less concave than that of the gas, the curves can intersect in two places. Therefore, at this T, there are two composition ranges at which a combination of gas and liquid is more stable. At lower T, G of gas moves up faster than G of liquid due to the entropy difference, so the intersections move closer together until finally the two curves touch each other at a single point. The composition at this point is the so-called azeotrope; at this concentration, the mixture boils at a well-defined boiling temperature, just as a pure substance would. liquid T gas liquid A B x Alternatively, if the gas free energy is less concave than that of the liquid, the phase diagram looks like the one on the right. In both cases, there is a limited range of concentrations at which purification by distillation is possible. High boiling azeotropes (nitric acid/H2O) Low boiling azeotropes (dioxane/H2O, ethanol /H2O)
pure B pure A Example of a Heterogeneous Mixture: solids with different crystal structures The properties of mixtures differ from the properties of pure subsatances. For example, the heterogeneous mixtures may melt at lower temperatures than their constituents (freezing point depression), or boil at elevated T (boiling point elevation). Example: Phase diagram for mixtures of tin and lead. Number of components: k=2, number of coexisting phases: phase refers to a Sn structure with Pb impurities, to the equivalent Pb structure, and + to the solid-state alloy of the two. Pure Sn melts at 2320C, pure Pb – at 3250C, but an alloy of 62%Sn+38%Pb melts at 1830C. This is not the result of the formation of any low-melting Sn-Pb compound: the solidified mixture contains regions of almost pure Sn side by side with almost pure Pb intermixed at a scale of ~1 micron. A mixture with eutectic (the lowest melting point) composition solidifies and melts at a single temperaure, just like a pure substance. Salt sprinkled on ice melts the ice because of a low eutectic temperature –21.20C of the H2O-NaCl eutectic. 10 m Microphotograph of the Pb-Sn eutectic
Coexistence of Phases, Gibbs Phase Rule The complexity of phase diagrams for multicomponent systems is limited by the “Gibbs’ phase rule”. This restriction on the form of the boundaries of phase stability applies also to single-component systems. Let’s consider a mixture of k components, and assume that the mixture consists of N different phases. For a multi-component system, the # of different phases might be > 3 (these phases might have different concentrations of components). In equilibrium,and the values of chemical potential for each component must be the same in all phases: k(N-1) equations ..... (in each phase, the sum of all concentrations = 1) N equations The lower index refers to a component, the upper index – to the phase. Each phase is specified by the concentrations of different components, xij. The total number of variables: , equations: . In general, to have a solution, the # of equations should not exceed the # of variables. Thus: For a single-component system (k=1), either two or three phases are allowed to be in equilibrium (but not four). Coexistance of three phases – the triple point.