Download
1 / 1
10 likes | 180 Views
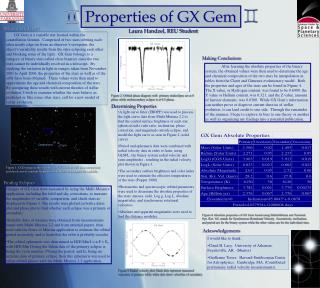
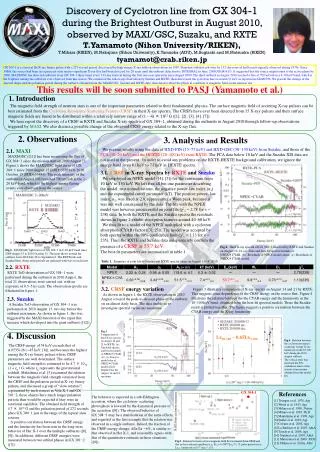
Discovery of Cyclotron line from GX 304-1 during the Brightest Outburst in August 2010, observed by MAXI/GSC, Suzaku, and RXTE T.Yamamoto (Nihon University/RIKEN), T.Mihara (RIKEN), M.Nakajima (Nihon University), K.Yamaoka (AGU), M.Sugizaki and M.Matsuoka (RIKEN) tyamamot@crab.riken.jp.

E N D
Discovery of Cyclotron line from GX 304-1 during the Brightest Outburst in August 2010, observed by MAXI/GSC, Suzaku, and RXTE T.Yamamoto (Nihon University/RIKEN), T.Mihara (RIKEN), M.Nakajima (Nihon University), K.Yamaoka (AGU), M.Sugizaki and M.Matsuoka (RIKEN) tyamamot@crab.riken.jp GX 304-1 is a classical Be/X-ray binary pulsar with a 272-second period, discovered by high energy X-ray balloon observations in 1967. Transient outburst activities by 132-day interval had been frequently observed during 1970s. Since 1980s, the source had been in a quiescent state and no significant X-ray flux had been detected for 28 years until the outburst detection by INTEGRAL in June, 2008(ATel#1613). It suggested that the source might return to the active phase by 2008. MAXI/GSC has detected outbursts from GX 304-1 three times every 132-day interval during the first one-year operation since August 2009. The third outburst in August 2010 reached a flux of 700 mCrab in a 4-10 keV band, which is the brightest among the outbursts ever observed from this source. We conducted the follow-up observation by Suzaku and RXTE, then discovered the cyclotron line at around 51 keV as reported in ATel#2796. We present the change of the spectral shape and the pulsation period during the outburst obtained from the MAXI/GSC, Suzaku and RXTE data, then discuss about the physical condition of magnetic field on the neutron star. This results will be soon submitted to PASJ (Yamamoto et al.) 1. Introduction The magnetic field strength of neutron stars is one of the important parameters related to their fundamental physics. The surface magnetic field of accreting X-ray pulsars can be best estimated from the Cyclotron Resonance Scattering Feature (CRSF) in their X-ray spectra. The CRSFs have ever been detected from 15 X-ray pulsars and their surface magnetic fields are found to be distributed within a relatively narrow range of (1 − 4) × 1012 G ([1], [2], [3], [4], [7]). We here report the discovery of a CRSF in RXTE and Suzaku X-ray spectra of GX 304−1, obtained during the outbursts in August 2010 through follow-up observations triggered by MAXI. We also discuss a possible change of the observed CRSF energy related to the X-ray flux. 2. Observations 3. Analysis and Results We present results using the data of HXD-PIN (15–75 keV) and HXD-GSC (50–130 keV) from Suzaku, and those of the PCA (10–20 keV) and the HEXTE (20–100 keV) from RXTE. The PCA data below 10 keV and the Suzaku XIS data are not used in the present. In order to avoid any problems on the RXTE-HEXTE background calibration, we ignore the energy band from 61 keV to 71 keV in HEXTE spectra. 2.1. MAXI MAXI/GSC ([11]) has been monitoring the flux of GX 304−1 since the mission start on 2009 August 15. Figure 1 shows the MAXI/GSC light curve of GX 304−1 since 2009 August 15 (MJD=55058) to 2010 October 15 (MJD=55484). The peak intensity of the outburst in August 2010 reached 500 mCrab in the 2–20 keV band, which is the highest among flaring events ever observed from the source. 3.1. CRSF in X-ray Spectra by RXTE and Suzaku We employed an NPEX model ([4], [5]) for the continuum from 10 keV to 130 keV. We left free all but one parameter describing the model: two normalizations, the negative power-law index (α1) and the exponential cutoff parameter (kT). The positive power- law index, α2, was fixed at 2.0, representing a Wien peak, because it was not well constrained by the data. The fits with the NPEX model was however unsuccessful on joint fits (χ2ν = 2.78 for ν = 238) data. In both the RXTE and the Suzaku spectra the residuals shown in figure 2 exhibit absorption features around 40–60 keV. We thus fit to a model of the NPEX multiplied with a cyclotron absorption (CYAB) factor ([3], [5]). The model was accepted by both spectra within the 90% confidence limit (χ2ν = 1.13 for ν = 235). Thus, the RXTE and Suzaku data independently confirm the presence of a CRSF at 53.7 keV. The best-fit parameters are summarized in table 1. Fig.2. Hard X-ray spectra of GX 304−1 observed by RXTE and Suzaku on August 13-14. (a): Data and best fit spectral models of NPEX×CYAB. (b): Residuals of NPEX model alone. (c): Residuals of NPEX×CYAB model. Fig.1. MAXI/GSC light curve of GX 304−1 in 2–20 keV band since 2009 August 15 to 2010 October 15. The inset shows around the outburst from 2010 July 28 to September 6. The RXTE(red) and Suzaku(blue) observation periods are indicated with bars in each inset. Table 1. Summary of joint fits to Suzaku and RXTE spectra taken on August 13-14, 2010. 2.2. RXTE RXTE ToO observations of GX 304−1 were performed during the outbursts in 2010 August, the total 21 observations were carried out, with an exposure of 0.5–5 ks each. The observation epochs are illustrated in figure 1. 3.2.CRSF energy variation As shown in fugure 1, the RXTE observations in 2010 August covered the peak-to-descent phase of the outburst on an almost daily basis. The data enable us to investigate spectral variations meantime. Figure 3 illustrates comparison of X-ray spectra on August 14 and 21 by RXTE. This suggests some dependence of the CRSF energy on the source flux. Figure 4 illustrates the relation between the the CYAB energy and the luminosity in the 10–100 keV band, obtained from the best-fit spectral models. There the Suzaku result is plotted together. The figure suggests a positive correlation between the CYAB energy and the X-ray luminosity. 2.3. Suzaku A Suzaku ToO observation of GX 304−1 was performed on 2010 August 13, two day before the outburst maximum. As shown in figure 1, this was triggered by the MAXI detection of the rapid flux increase which developed into the giant outburst ([12]). Fig.3. Comparisonf of hard X-ray spectra on August 14 and 21 by RXTE. (a): Unfolded spectra and best fit models of NPEX×CYAB. (b), (c): Data-to-model ratio of NPEX×CYAB models fixed Depth=0 for the August 14 and 21 spectrum. 4. Discussion GX 304-1 Lx10-100 ~ 0.65Lx3-100 Fig.4. Relation between the cyclotron resonance scattering energy X-ray luminosity in the 10-100 keV during the 2010 August outburst. The vertical error bars represent the 90% confidence limits of the statistical uncertainty, obtained from the model fits. The CRSF energy of 54 keV exceeds that of A 0535+26 (∼45 keV; [8]), and becomes the highest among the X-ray binary pulsars whose CRSF parameters are well determined. The surface magnetic field strength is estimated to be 4.7 × 10¹² (1 + zg ) G, where zg represents the gravitational redshift. Makishima et al. [5] examined the relation between the magnetic field strength estimated from the CRSF and the pulsation period in X- ray binary pulsars, and discussed a group of “slow rotators”; represented by such sources as Vela X-1 and GX 301−2, these objects have much longer pulsation periods than would be expected if they were in rotational equilibria. The obtained field strength of 4.7 × 10¹² G and the pulsation period of 272 seconds place GX 304−1 just in the range of the typical slow rotators. A positive correlation between the CRSF energy and the luminosity has been seen in the long-term behavior of Her X-1 over the multiple outbursts ([6], [9]). In additions, different CRSF energies were measured between two orbital phases in GX 301−2 ([7]). Fig.5. Relation between surface magnetic field B of estimated from CRSF and that in the rotational equilibria (e.g. B12 = 0.43P7/6Lx371/2). P: pulse period of sec, Lx37: luminosity in 1037 erg s-1. [5] References The behavior is expected in a sub-Eddington accretion, where the cyclotron- scattering photosphere is lowered by the dynamical pressure of the accretion ([9]). The observed behavior of GX 304−1 may be a manifestation of the same effects, and regarded as the first example that the relation was observed in a single outburst. Indeed, the fraction of the CRSF-energy change, ∆Ea/Ea ∼6%, is similar to that observed in Her X-1, and reasonably agrees with that of the quantitative estimate in these situations ([9]). [1] Trumper et al. 1978, Apj [2] White et al. 1983, Apj [3] Mihara et al. 1990, Nature [4] Mihara et al. 1995, Ph.D. [5] Makishima et al. 1999, Apj [6]Gruber et al. 2001, Apj [7] Coburn et al. 2002, Apj [8] La Barbera et al. 2005, A&A [9] Terada et al. 2006, Apj [10] Staubert et al. 2007, A&A [11] Matsuoka et al. 2009, PASJ [12] Mihara et al. 2010a, ATel