Download
1 / 30
300 likes | 435 Views
Assimilation of surface sensitive infrared channels over land at Environment Canada. L. Garand, S.K. Dutta, and S. Heilliette DAOS Meeting Montreal, Qc August 15-16, 2014. Outline. Context & motivation Approach Assimilation results ________________________ Also: Update on PCW mission.

E N D
Assimilation of surface sensitive infrared channels over land at Environment Canada L. Garand, S.K. Dutta, and S. Heilliette DAOS Meeting Montreal, Qc August 15-16, 2014
Outline • Context & motivation • Approach • Assimilation results ________________________ • Also: Update on PCW mission
Context & motivation Env. Can. moving to ensemble-variational system with: • Flow-dependent background errors including surface skin temperature correlations with other variables • Analysis grid at 50 km, increments interpolated to model 25 km grid (15 km in 2015) • ~140 AIRS and IASI channels assimilated: many sensitive to low level T, q, and Ts. RTM is RTTOV-10. Favorable context to attempt assimilating surface-sensitive IR channels over land and sea-ice vs earlier work with GOES (Garand et al. JAM, 2004) with analysis grid at 150 km and no hyperspectral IR.
Ensemble spread of Ts (Feb-Mar 2011) 00 UTC 06 UTC Maximum ~15h local In SH (summer) Maximum at night Tibetan area (winter) Ts background error over land in 4Dvar is Constant: 3 K. In EnVar, B is 0.5(BENKF+ BNMC) 12 UTC 18 UTC
Ensemble T(~964 hpa) spread (Jan-Feb 2011) 00 UTC 06 UTC Only minor variations with local time Values < 0.5 K in SH seem underestimated 12 UTC 18 UTC
Key factors to consider • Reliable cloud mask • Spectral emissivity definition (CERES, U-Wisconsin) • Highly variable topography • Radiance bias correction • Background and observation error definition
Approach guided by prudence Assimilate under these restrictive conditions over land and sea ice: • Estimate of cloud fraction < 0.01 • High surface emissivity (> 0.97) • Relatively flat terrain (local height STD < 100 m) • Diff between background Ts and retrieval based on inverting RTE limited to 4K Radiance bias correction approach: • For channels flagged as being surface sensitive, use only ocean data to update bias coefficients
Assigned observation error to radiances Assigned= f std(O-P) Desroziers = <(O-P)(O-A)> 15.0mm 4.13mm 15.3mm 4.50mm f typically in range 1.6-2.0
Limitation linked to topography Criterion used: local STD of topography < 50 m (on 3X3 ~50 km areas) RED: accepted, white std > 100 m, blue 100>std>50 m
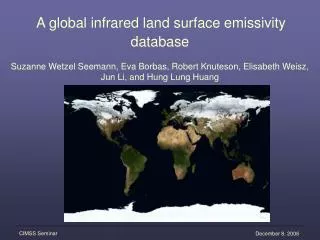
Limitation linked to surface emissivity Surface emissivity AIRS ch 787 Emissivity based on CERES land types (~15 km) + weighted average for water/ice/snow fraction. Accept only emissivity > 0.97 ; Bare soil, open shrub regions excluded.
Examples of emissivity from CERES 10.7 micron 3.9 micron water: 0.990 water: 0.977 A large portion of land masses have surface emissivity > 0.97
First attempt: negative impact in region 60-90 N/S 00 hr 72hr Possible cause: cloud contamination ?
Second attempt: added constraints • Cut latitudes > 60 deg • Local gradient of topography < 50 m (was 100 m) Strong impact on (O-B) stats for surface channels
T std error diff. (CNTL-EXP) NH-Extratropics 6 Feb to 31March 2011 vs ERA Interim vs own analysis Consistent positive impact vs ERA Interim and own
T std diff (CNTL-EXP) vs ERA-Interim Tropics SH Extratropics
(a) (b) Time series of T std diff at 850 hPa CNTL EXP NH extratropics Tropics EXP superior to CNTL 54-66 % of cases at days 3-5
850 hPa TT anomaly cor. CNTL EXP NH extratropics Tropics
120-h N-Extr vs ERA-Interim CNTL EXP U HR GZ T
Validation vs raobs 120-hFeb-Mar 2011 (59 days) CNTL EXP SH-extratropics NH-extratropics U V U V GZ T GZ T
Validation vs raobs 120-hFEB-Mar 2011 (59 days) CNTL EXP North America Europe U V U V GZ T GZ T
Added yield: about 15%(for surface sensitive channels) CNTL EXP Number of radiances assimilated for surface channel AIRS 787 CNTL: ~1400/6h EXP: ~1600/6h Region: world, EXP excludes surface-sensitive channels at latitudes > 60 Radiance thinning is at 150 km
Std/bias of (O-P) and (O-A), AIRS 787CNTLEXP O-P O-A No major impact on bias. Strong assimilation over land, with std (O-P) of ~1.7 K, std (O-A) of 0.40 K (not shown)
Conclusion • Very encouraging results, especially in NH where most of new data are assimilated Next steps: • Relax limitations on emissivity, use MODIS-derived atlas • Run a summer cycle • Seek operational implementation Longer term • Evaluate problems specific to high latitudes
Update on Polar Communications and Weather (PCW) mission Goal: Fill communication and meteorological observation gaps in the Arctic Most likely configuration: 2 satellites in highly elliptical orbits Status: Seeking approval from Government in early 2015. Could start operating in 2021. Meteorological instrument: Similar to ABI or FCI A possible 2-sat HEO system
Capabilities ‘GEO-like’ continuous imaging of Arctic circumpolar region ‘GEO-like’ spatial (1-3 km) and temporal (15 min) resolution ‘Next-generation’ meteorological imager (ABI, FCI, 16+ channels) Near-real time processing to L1c for delivery to Environment Canada Compatibility with GEO imagers as part of WMO Global Observing System. Weather:High-Level Requirements
Orbit Comparison(2-sat Constellation) Molniya (12-h) Apogee: 39,800 km TAP (16-h) Apogee: 43,500 km Tundra (24-h) Apogee: 48,300 km
Science Studies: Uniqueness of HEO System vs LEO 23 LEO satellites needed to get 15 min Imagery at 60 N, versus 2 HEO Trichchenko and Garand, Can. J. Remote Sensing, 2012 Also, capability to get image triplets for AMV vastly superior to LEO
Science Studies:Impact on NWP OSSE showing significant impact of PCW AMVs filling gap in polar areas Garand et al., JAMC, 2013 Positive impact (blue) at 120-h In both polar regions from 4 satellites
Example of PCW Geometry Matching[16-hr TAP Orbit] for intercalibration VIIRS/SNPP GEO Trishchenko and Garand, GSICS Newsletter, 2012