Download
1 / 34
370 likes | 934 Views
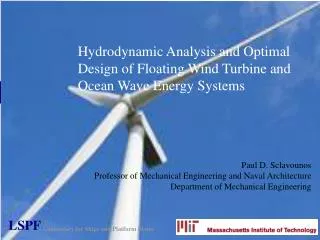
LSPF. Laboratory for Ships and Platform Flows. Hydrodynamic Analysis and Optimal Design of Floating Wind Turbine and Ocean Wave Energy Systems. Paul D. Sclavounos Professor of Mechanical Engineering and Naval Architecture Department of Mechanical Engineering.

E N D
LSPF Laboratory for Ships and Platform Flows Hydrodynamic Analysis and Optimal Design of Floating Wind Turbine and Ocean Wave Energy Systems Paul D. Sclavounos Professor of Mechanical Engineering and Naval Architecture Department of Mechanical Engineering
Advantages of Floating Offshore Wind Farms • Wind a Rapidly Growing, Free, Inexhaustible, Environmentally Friendly, Utility Scale and Cost Effective Energy Source • Vast Offshore Wind Resources with Higher and Steadier Wind Speeds in Deeper Waters • Over 75% of Worldwide Power Demand From Coastal Areas • Wind Power Output Increases with Cube of Wind Speed • Lower Offshore Wind Turbulence – Longer Farm Life ~ 25-30 Years • Connection to Electric Grid by Sub Sea AC or HVDC Cables • Experience of Oil Industry Essential for the Development of Safe and Cost Effective Spar and TLP Wind Turbine Floaters • Floating Wind Turbines Provide Infrastructure for Arrays of Wave Energy Converters in Waters Depths over ~ 40m with Significant Wave Power Density
Horns Rev Wind Farm (Denmark) - Rated Power 160 MW – Water Depth 10-15m
Expensive Installation Process for Seafloor Mounted Turbines
Floating Wind Turbine Attributes • Water Depths of 30 – 1000 m • 5-MW Wind turbine: 1 GW Floating Wind Farm (200 Units) • Flexible Installation process: • Full Assembly at a Coastal Facility • Ballasted TLP or Spar Buoy • Tow Stable Floating Wind Turbine at Offshore Wind Farm Site • Tow In of Floating Wind Turbine for Major Maintenance • Gravity Anchors for TLP Tethers • Conventional or Synthetic Catenaries for Spar Buoy • Attractive Economic and Financial Attributes
Coastal Zone of Visual Influence (ZVI) • L Distance from Shore for Turbine to be Invisible • H Max Height of Turbine Blade Tip (90 + 65=155 m) • R Earth Radius (~ 6,370,000 m) • L = 28 miles (45 Km) (H=155m - Blade Tip) • L = 21 miles (34 Km) (H=90m - Hub)
New Jersey Offshore Wind Farm Courtesy: NY Times
Spar and TLP SML Simulation Modelsof MIT Laboratory for Ship and Platform Flows
Wind Turbine Floater Analysis & Design • Design Studies • Sea States • Design Models • Tension Leg Platform • Spar Buoy in SLC (Single-Layer Catenary) • Spar Buoy in DLC (Double-Layer Catenary) • Pareto Optimization Analysis
Sea Spectra ITTC (International Towing Tank Conference) Standard
Fairlead Position Design Models: Spar Buoy in SLC =
Offshore Wind Capacity Factor • Assessment of Offshore Wind Resource – Wind Velocity Probability Distribution • Ideal Efficiency of Wind Turbine in Steady Wind – Betz Limit : η=16/27=0.59 • Reported Efficiencies of Large Scale Wind Turbines ~ 50% • Advanced Control Systems to Enhance Power Absorption from High Wind Gusts • Height of Tower, Size of Rotor and Electric Generator – Cost Benefit Analysis • Capacity Factor: Percentage of Time Wind Turbine Generates Power at its Rated Capacity • Offshore Wind Capacity Factors (CP) ~ 40-45% • Available Wind Power per 1 GW Offshore Wind Farm at 40% CP ~ 400 MW
Wave Energy Capacity Factor • Wave Power in Storm with 3m Height / 8 sec Period / 100 m Wavelength ~ 36 kW / meter • Wave Power in Storm with 10m Height / 12 sec Period / 200m Wavelength ~ 500 kW / meter • More Wave Power Encountered in Water Depths Over 40 m (Waves do not feel seafloor) • Maximum Wave Power Captured by Point Wave Energy Absorber ~ Wavelength/ 2π (m) • In 3m Seastate ~ 573 kW / Absorber; In 10m Seastate ~ 15 MW / Absorber • Spacing of Point Absorbers ½ a Wavelength – Wave Power Output Increases by 50% • Use of 100 Absorbers Rated at 1 MW Between 4 Wind Turbines – Power Output ~ 150 MW • Maximum Utilization of 1 GW “Offshore Wind Farm Real Estate” – 150x13x13 MW ~ 25 GW • Capacity Factor of Ocean Wave Energy ~ 30% • Available Wave Power per 1 GW Rated (400 MW Available) Offshore Wind Farm ~ 7.5 GW
Floating Wind Farm Financial Attributes • Annual Revenues of 1 GW Farm (200 5 MW Units) @ 40% Capacity Factor and @10 cents/KWh: ~ $400 Million • Breakeven Cost vs CCGT ~ $ 3 M/MW: Based on Natural Gas Price Projections $9-15/MMBtu from 2010-2027 • Breakeven Cost per Floating 5 MW Unit: $15 M; 1GW Wind Farm: $3 B • Onshore 5 MW Unit Cost ~ $10 M; Breakeven Cost of Floater & Mooring System ~ $5 M • O&M: Unit Ballasted & Towed to Shore – On Site Routine Maintenance • Interconnection Costs ~ 15-20% of Capital Costs ~ $ 450-600 M for 1 GW Farm • AC Sub Sea Cables up to ~ 100-130 km. HVDC Light Technology over 100-130 km • Coal Plant Emits ~ 1 ton CO2/MWh; Combined Cycle Gas Turbine Emits ~ 300 Kg CO2/MWh • At $10/ton of CO2 – Emissions Credit ~ 1 cents/KWh; 10% Increase in Revenue
Floating Wind Farms vs. Oil & Gas Reservoirs • 1 Barrel of Oil ~ 130 kg ~ 1.5 MWh of Energy (~ 12 kWh / kg) • 1 MW of Rated Wind Turbine Power @ 40% Capacity Factor ~ 9.6 MWh / Day ~ 6.4 Barrels of Oil / Day • Conversion Efficiency of Oil & Gas Engines / Turbines, Wind Turbines ~ 40-50% • 1 GW Wind Farm (30 year life) ~ 70 M Barrel Oil Field ~ 6,400 Barrels / Day • Breakeven Cost of Wind Turbines $3M / Rated MW = $3 B / Rated GW • Equivalent Cost per Barrel of Oil ~ $43 / Barrel • Investment Risk in Oil & Gas: Exploration Costs & Volatility of Oil & Gas Prices • Investment Risk in Wind: Volatility of Wind Speed & Electricity Prices
Summary • Optimized Spar Buoy and TLP Wind Turbine Floaters • Low Responses – Use of Onshore Wind Turbines • Hybrid Offshore Wind & Wave Farms • Optimal Control to Enhance Wind and Wave Power Output • Design of Offshore Electric Grids • Attractive Economic Attributes • Project Finance for Utility Scale Offshore Wind & Wave Farms