Download
1 / 17
170 likes | 193 Views
Energy fixation involves trapping solar energy through photosynthesis and converting it into chemical energy, crucial for sustaining life in ecosystems. Learn how energy flows through trophic levels, the significance of primary productivity, and the dynamics of energy transfer among producers, consumers, and decomposers.

E N D
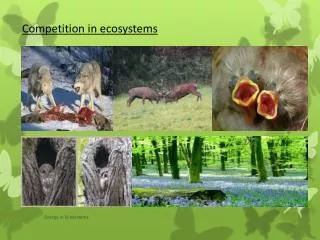
Circulation in Ecosystems Energy Fixation Energy Flow
Energy Fixation Energy fixation involves energy from the sun being trapped or fixed by photosynthesis and converted into chemical energy. Energy • In an ecosystem energy is constantly being degraded and lost e.g. as heat. It needs to be constantly replaced.
This chemical energy (contains carbon, hydrogen and oxygen) can be assimilated by other living organisms. • In a plant the total amount of light energy converted into organic matter is called the gross primary production. (GPP).
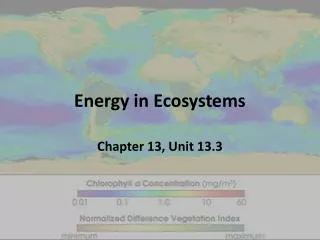
Plants use between 15-70% of this GPP for processes such as respiration. The energy that remains is called the net primary production (NPP). It is the energy that is available for assimilation by other organisms. • Primary productivity can be measured as biomass (dry mass of organic matter) per unit area or volume.
Oceans are the most important contributor due to size, however they are not actually very productive due to light being a limiting factor at a few meteres depth.
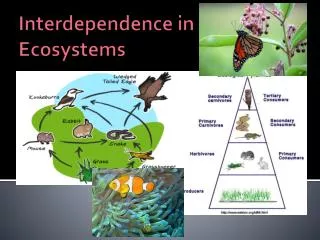
Energy Flow • Once energy has been fixed it is transferred through the ecosystem. Energy transfer occurs between different niches. A niche is a role that an organism occupies within a community.
Niches – The producers (autotrophs) These organisms use simple inorganic molecules to make complex organic molecules. The consumers (heterotrophs) These organisms use complex organic compounds to obtain energy.
The decomposers (saprotrophs) These organisms use dead or decaying material to obtain energy. They secrete enzymes into the material to digest it and they absorb the liquid.
These organisms operate within trophic levels • Primary producer • Primary consumer • Secondary consumer • Tertiary consumer
From each trophic level energy is lost as heat. A portion of it is lost , to the decomposer level, as faeces and waste. • The energy that remains is available for the next trophic level. Approx 10% of the available energy is transferred to the next level, called trophic efficiency.
This 10% rule, means that there is a limit to the number of trophic levels that there are in the ecosystem. Usually no more than 4 or 5. • There is rarely enough energy available at the higher trophic levels to support large numbers of consumers. The number of organisms at each level can be represented as a pyramid of numbers.
Pyramid of Numbers • This representation does not always hold true, as it does not take account of the fact that one organisms e.g. oak tree, can be large in size and support a large number of organisms at the next trophic level.
Such a situation would be represented as follows: Pyramids of biomass are often used instead.
Pyramid of biomass • This is where the total dry weight of all organisms in each level is represented. • The majority of systems show themselves to be pyramids. However there are exception. For example, the English Channel’s small biomass of phytoplankton support a larger biomass of zooplankton. This is because the phytoplankton are reproducing and being eaten equally rapidly
A more reliable model for representing the trophic levels is a pyramid of productivity. Pyramid of Productivity • These are always pyramid shaped as productivity takes into account both the size of the organisms and the rate of energy flow over time (Kj/m2/yr).
However, calculating the productivity of organisms at each trophic level is extremely difficult, so usually a pyramid of biomass is used.