Market Dynamics through Graphs and Concepts
Explore various economic graphs and concepts like AS/AD, PPF, LS/LD to understand how markets work. Learn about market effects such as Price Floors and Price Ceilings and how they impact supply and demand. Discover the interplay between labor, loanable funds, and goods/services in the economy.

Market Dynamics through Graphs and Concepts
E N D
Presentation Transcript
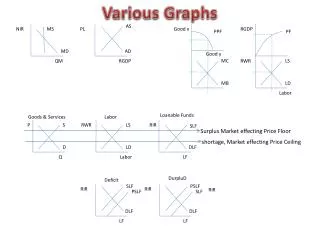
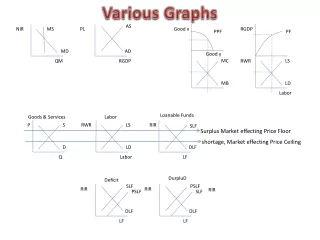
Various Graphs AS NIR MS PL RGDP Good x PF PPF MD AD Good y MC LS RWR QM RGDP MB LD Labor Loanable Funds Goods & Services Labor P S LS RIR RWR SLF Surplus Market effecting Price Floor shortage, Market effecting Price Ceiling D LD DLF Q Labor LF DurpluD Deficit SLF PSLF RIR RIR RIR PSLF SLF DLF DLF LF LF
_____________Market _____________Market GraphChapter PPF 3 S/D 4 PF 8 LS/LD 9 GraphChapter SLF/DLF 10 MS/MD 12 AS/AD 13
PPF & PF Good x RGDP PF Attainable, efficient Unattainable Unattainable Attainable, inefficient Attainable PPF GOOD y Labor
S Firms Supply Goods and Services P P S1 S2 S2 S1 D D Q Q • CURVE SHIFTS: • $price of good/service (graphed) = $ qty S • #price of substitute in production = $ S • $price of complement in production = $ S • #resource price or other input price = $ S • Future Prices expected to # = $ S • $number of sellers = $ S • $productivity = $ S
D Households Demand Goods and Services P P S S D1 D2 D2 D1 Q Q • CURVE SHIFTS: • $price of good/service (graphed) = $ qty D • $price of substitute in consumption = $ D • #price of complement in consumption = $ D • Income # (inferior good) = $ D • Income $ (normal good) = $ D • Future Prices expected to $ = $ D • Future Income expected to $ = $ D • $number of buyers = $ D • r in preferences = $ D (item A) and # D (item B)
LS HOUSEHOLDS Supply Labor RWR RWR LS1 LS2 LS2 LS1 LD LD LABOR LABOR • CURVE SHIFTS: • $ LS = #income taxes • $ LS = #unemployment benefits • $ LS = $population
LD FIRMS Demand Labor RWR RWR LS LS LD2 LD1 LD1 LD2 LABOR LABOR • #LD = #Productivity
SLF RIR RIR SLF1 SLF2 SLF2 SLF1 DLF DLF LF LF • CURVE SHIFTS: • # SLF = #Disp. income • # SLF = $Wealth • # SLF = $Exp. Future income
DLF RIR RIR SLF SLF DLF2 DLF1 DLF1 DLF2 LF LF • CURVE SHIFTS: • # DLF = #Exp. profit • Bus. Cycle expansion • Technology, successful new products • # Population
MS MS1 MS2 MS2 MS1 NIR NIR MD MD QM QM • LONG RUN: • Fed makes Open Mkt purchase #Qty $$ NIR $ RIR • #borrowing/investing (spending habits change) • change in production and prices • Thus, Shortrun NIR adjusts, Longrun PL adjusts • Short run # qty$ = $IR • Long run # qty$ = #price level • #V = #inflation rate • CURVE SHIFTS: • $ MS = #RRR • $ MS = #Disc rate • $ MS = Selling Securities • $ MS = banks make smaller or less loans • $ MS = people deposit less money
MD MS MS NIR NIR MD2 MD1 MD1 MD2 QM QM • CURVE SHIFTS: • # MD = #PL • # MD = #RGDP • Financial Technology • # MD = #ATMs • $ MD = #Credit Cards
AS PL PL AS1 AS2 AS2 AS1 AD AD RGDP RGDP LONG RUN: #price level #MD #NIR #RIR $spending $qty RGDP demanded $AD #price level $RWR • CURVE SHIFTS: • # AS = #Pot. GDP • # AS = $MWR • # AS = $Money price of other resource
AD PL PL AS AS AD2 AD1 AD1 AD2 • CURVE SHIFTS: • # AD = #Exp. Future income, inflation, profits • #AD = $taxes • # AD = #Transfer pmts/Govt. Expenditure • # AD = #qty money • #AD = $Interest rate • #AD = #ForeignIncome • #AD = #Global economy (expands) • # AD = $Exchange rate RGDP RGDP #exchange rate (from 100yen to 125 yen for $1) = cheaper foreign goods (12,500yen goes from $125 to $100) = #imports (we buy more of their goods) = $AD (and less of ours)
SURPLUS WAGE P LS S LABOR SURPLUS SURPLUS LD D LABOR Q
SHORTAGE WAGE P LS S SHORTAGE LABOR SHORTAGE LD D LABOR Q