ME 322: Instrumentation Lecture 18
160 likes | 401 Views
ME 322: Instrumentation Lecture 18. March 3, 2014 Professor Miles Greiner. Announcements/Reminders. HW 7 due Friday Lab 6 (wind tunnel) this week Please see schedule and be on time

ME 322: Instrumentation Lecture 18
E N D
Presentation Transcript
ME 322: InstrumentationLecture 18 March 3, 2014 Professor Miles Greiner
Announcements/Reminders • HW 7 due Friday • Lab 6 (wind tunnel) this week • Please see schedule and be on time • http://wolfweb.unr.edu/homepage/greiner/teaching/MECH322Instrumentation/Labs/Lab%2006%20Fluid%20Flow/Lab%20Index.htm • Bring Excel from HW 6 and use it to process the data you acquire. • This will help check the data as you take it and allow you to complete the data acquisition phase of the lab in one hour
Thermocouples + TS VOUT TT • Consist of two dissimilar metal wires, A(+) & B(-) connected to a digital voltmeter (copper terminals C) • Output voltage VOUT depends on the sensing junction temperature TS • However, VOUT’s sensitivity S = 20–50 mV/°C is very small • Moreover, VOUT also depends on (undesired inputs) • Terminal temperature TT • High Frequency Radio Frequency Noise • Ground loop currents -
In ME 322 Labs • Type J (Iron/Constantan) thermocouples • + Iron (white insulation) • - Constantan (red or white with red stripe insulation) • Omega DRE–TC-J TC Signal Conditioner ; • http://wolfweb.unr.edu/homepage/greiner/teaching/MECH322Instrumentation/Labs/Lab%2007%20Boiling%20Water%20Temperature/Lab7%20Index.htm • Wiring: • Iron (white insulation) goes to +Tc; Constantan (red stripe) goes to (-Tc) • Output Voltage, VSC: Com = -; VOUT = + • Power: 110 VAC (top) + - Constantan ( )
Transfer Function (Type-J-TC/DRE–TC-J TC) ? Out of range Transfer Function 10 • For TS < 400C • (linear) • ; = 500 • To use: Inverted transfer function: TS = (40°C/V)*VSC • Conditioner Provides • Reference Junction Compensation (not sensitive to TT) • Amplification (Allows normal DVM or computer acquisition to be used) • Low Pass Filtration (Rejects high frequency RF noise) • Linearization (Easy to convert voltage to temperature) • Galvanic Isolation (TC can be used in water environments) Reading VSC [V] 0 400 Measurand, T [°C] 0
Computer Data Acquisition (DAQ) • Sensors detect measurands and produce signals • Voltages, currents, resistances, pulses,… • Conditioners convert those output signals to voltages • A multiplexer (MUX) sweeps channel to channel and feeds individual signals, at different times, to the Analog-to-Digital (A/D) converter • The A/D converter samples real signals (7.674337…V) and converts them to integers (0, 1, 2,…) that the digital computer can work with. • Computer programs store and/or process the data • In ME 322r: LabVIEW(Handout version 2011 (old)) and DAQmx drivers (download)
Lab 7 Boiling Water Temperature in Reno • Elevation 4500 ft, PATM = 86 kPa (101.3 kPaat sea level) • Beaker, water, immersion heater • Type-J TC, DRE–TC-J TC Signal Conditioner • National Instruments myDAQ (USB to computer)
National Instruments myDAQ • $179 on Studica • http://www.studica.com/us/en/NI-Hardware-Only/student-ni-mydaq/781325-01_2.html?utm_source=google&utm_medium=ppc&kpid=734446&gclid=CJXw956H8LwCFYlafgodb3wAMg • TC Signal Conditioner output • To Analog Input (AI) Channel 0 (could have used channel 1) • COM to 0- and AGND (negative analog input and ground) • Vout to 0+ (positive analog input)
Check Connections • Open NI–MySystem-Measurement & Automation Explorer • This program comes with LabView • MySystem (upper left corner) • Device & Interfaces (Double Click) • MyDAQ (Right Click) • Device Pin outs • Test Panel
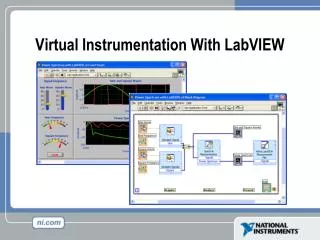
Lab 7 LabVIEWData Acquisition Program • Called a VI – Virtual Instrument • Front Panel – Indications and Controls • Block Diagram – Devices, connections and logic • Lab 7 Objectives • Measure VOUT from AI channel 0 for 3 seconds • Sample rate 1000 times per second • Convert to TS = (40°C/V)VOUT • Plot Temperature versus time on front panel • Write data to an Exel file • Find average temperature, TAVG
LabVIEW Five Main Acquisition Steps Measurement I/O, NI DAQmx • Create a channel • Timing • Start Process • Read Data analog waveform • 1 Channel • N-Samples • Output voltage – convert to ̊ C • Clear the test Programming; Dialog and User Interface simple error handler You will need to download and install DAQmx to on your computer (after installing LabVIEW) find these icons. In this class we give and modify example LabVIEW programs to help you quickly learn to perform data acquisition. However, we don’t deal with structured programming.
Lab 7 VI Objectives • Measure atmospheric pressure PATM • Find TSAT at that pressure • Allow water in beaker to reach a full, rolling boil • Measure VOUT for 3 sec • Sample 1000 times per second • Convert to TS = (40°C/V)VOUT • Plot Temperature versus time • Write to a file • Find average temperature, TAVG • Repeat for ice/water mixture and room temperature water • Compare to liquid in glass thermometer • Is TAVG,Boil ± wTavg ~ TSAT • Determine effect of salt in the water