Download
1 / 18
180 likes | 261 Views
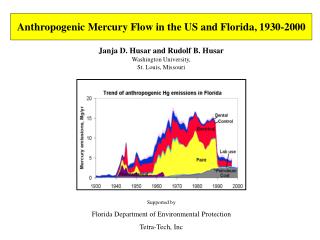
Explore the trends of mercury flow across the US, focusing on Florida's mercury flow through fuels from 1980-2000. Understand production, consumption, and disposal of mercury in air, land, and water using materials flow methodology. Analyze mercury content in US coals and its mobilization by region.

E N D
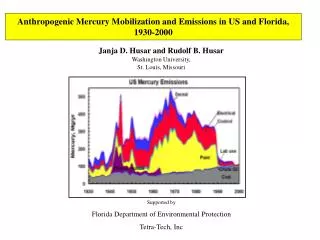
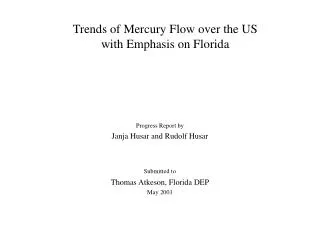
Background Goal: • Develop a trend database for mercury flow over the US. Special emphasis on: • Mercury flow through fuels • Time epoch 1980-2000 and • Geographic region of Florida. Approach: • Materials flow methodology. Mercury budgeting from the production (mining) through processing, consumption to the disposal in air, land and water.
Net Import Stock Stock Release Mining Production Consumption Mine Production Secondary Production Recycling Trend of the US ‘Apparent’ Mercury Supply, 1970-1998 • Apparent supply is = primary and secondary production + net imports + gov. stockpile to Sznopek and Goonan, 2000
Mercury in consumer goods and coal • 1940-1970 mercury in industrial goods was not well categorized. • 1970-1990 electrical and electronic instruments category (including batteries) was the dominant Hg industrial consumer. • Hg consumption for industrial goods was reduced from around 2000 Mg/yr in 1980 to about 500 Mg/yr in 1995.
Mercury in US consumer goods and coal in 1990s • Chlor-alkali and electrical and electronic instruments are still dominant users of mercury. • Coal mined and consumed in US contributes
Atmospheric Emissions of Mercury EPA Mercury Study Report to Congress, 1997
Mercury Flow through Coal over the US • Introduction • Approach
US Coal Production by Region • Coal production in the US occurred over five major producing regions. • The coal production over the eastern US has remained roughly constant throughout the century. • The sharp increase since the 1980s is due to the addition of western coal.
Mercury Content of US Coals • Each coal producing region has a well defined range of coal mercury content. • Evidently the pattern of coal mercury content is highly variable. • USGS has an extensive database of coal mercury content covering most of the regions.
Mercury Mobilization by Coal Producing Region • The mercury mobilization follows the pattern of national coal production. • Since the beginning of the century there was a slight decline (from 0.18 to 0.14 ppm) of average coal mercury concentration due to shifts in regional production. • There was a sharp rise since the 1980s. In 1995 the mercury mobilization by coal was 144 Mg/yr. • This constitutes an upper bound on coal mercury emissions to the atmosphere. Average Hg in US Coal, ppm
Mercury Flow through Coal in Florida • Introduction • Approach: • Determine the origin of the coal used in Florida • Assign mercury concentration to each coal source • Estimate the fraction of Hg retained at the mines and fly ash (25-50%) • Calculate the coal mercury emission rate for 1985 and 1998.
Origin of Coal Hg in Florida Origin of Coal in Florida Coal Origin: • In 1985, the coal consumed in Florida was from Eastern Kentucky, Western Kentucky and Illinois • In 1998, the coal consumed in Florida was more diverse. About 20% originated from Wyoming, West Virginia, Virginia Coal Hg Origin: • Coal mercury in Florida is dominated by Eastern Kentucky coal with contributions from Western Kentucky and Illinois • In 1998, the coal mercury included contributions from Wyoming, West Virginia, Virginia
Approximate Trend of Mercury in Coal Consumed in Florida • The coal mercury content in Florida exhibits a slow rise between 1960 and 1980, sharp rise between 1980 and 1990, followed by constant levels in the 1990s. • The 1998 estimated mercury content of mined coal used in Florida was about 4 Mg/yr. • For the approximate historical trends an average coal mercury concentration of 0.15 ppm was assumed. • The mercury emitted to the atmosphere is only a fraction (0.5-0.75) of the mined coal mercury due to the retention at the mines (coal washing) and at the combustion plant as fly ash. • The estimated coal mercury emission to the atmosphere in the 1990s was about 2-3 Mg/yr.
Summary and Plans Summary of Activities • Studied and evaluated the recent literature on mercury flows over the US. • Begun reconstruction of the coal mercury flow over the US. It is found that the relative contribution of coal mercury compared to other sources has been increasing over the 1990s. • The coal mercury emission trends were crudely estimated, showing a sharp rise since the 1980s and leveling off in the 1990s. Immediate Plans • Compile coal distribution and mercury content data. • Estimate oil mercury flows.
Hg Stocks Multimedia Mercury Flow, 1996 (incomplete) Export/Import Export/Import • Tentative multimedia flow diagram of mercury for the US. • Neither the flow chart, nor the flow rates and stocks are fully developed 372 76 Supply Production Consumption 446 Recycling 144 295 Air Land Water Sznopek and Goonan, 2000
Alternative Mercury Flow Diagram (In Progress) 372 Supply Production Consumption 446 53 295 Recycling Land Air Land Fuels Industrial