Download
1 / 4
40 likes | 205 Views
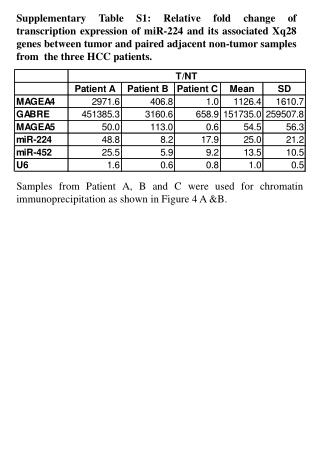
Supplementary Table S1: Relative fold change of transcription expression of miR-224 and its associated Xq28 genes between tumor and paired adjacent non-tumor samples from the three HCC patients.

E N D
Supplementary Table S1: Relative fold change of transcription expression of miR-224 and its associated Xq28 genes between tumor and paired adjacent non-tumor samples from the three HCC patients. Samples from Patient A, B and C were used for chromatin immunoprecipitation as shown in Figure 4 A &B.
Supplementary Figure S1: Testing of antibodies used for chromatin immunoprecipitation Western blot analysis of EP300, HDAC1, Histone H3, acetylated form of H3 at lysine 9 (H3K9) and lysine 14 (H3K14), normalized against loading control β-Actin, in NeHepLxHT cells treated with blank, 20 µM 5-Aza, 0.5 µM TSA or 5 µM SAHA, for 72 hours.
Supplementary Figure S2: GABRE expression changes in different stages of HCC. GABRE expression was extracted from a study conducted by Wurmbach et al (Hepatology 2007;45:938-47) using NextBio. Red box indicates the progressive increase in fold change of GABRE expression in liver dysplasia.
Supplementary Figure S3: Representative ChIP assay on NeHepLxHT cells treated with epigenetic drugs I B H3K9 ChIP C A D G F Rn H E K J II A C B D H3K14 ChIP F E H Rn G J K Quantitative PCR amplification plots of ChIP assay to measure enrichment of miR-224 residing GABRE Intron6 region. Samples presented here include input DNA from untreated cells (A), 5-Aza treated cells (B), TSA treated cells (C) and SAHA treated cells (D), anti-H3K9 or anti-H3K14 ChIP enriched DNA from untreated cells (E), 5-Aza treated cells (F), TSA treated cells (G) and SAHA treated cells (H), unrelated anti-EGFP (J) or no antibody (K) enriched DNA.