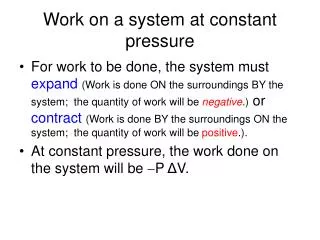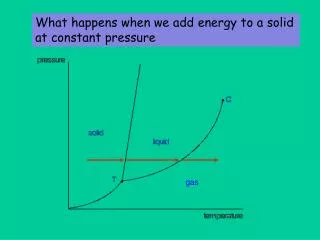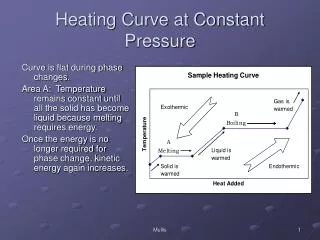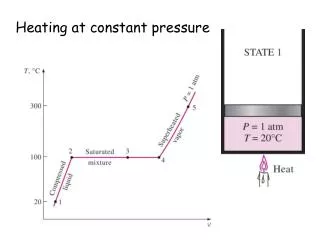
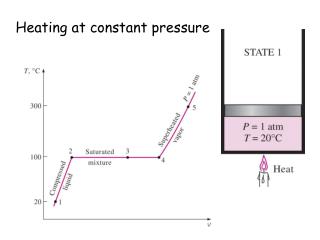
Heating at constant pressure
Heating at constant pressure. T-v curves for a range of pressures. T-v phase diagram. P-v diagram. P-T diagram. critical point. liquid. coexistence curve. vapor. compressed liquid ≈ saturated liquid at the same temperature.

Heating at constant pressure
E N D
Presentation Transcript
P-T diagram critical point liquid coexistence curve vapor
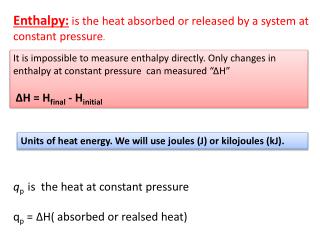
compressed liquid ≈ saturated liquid at the same temperature Steam, water, water vapor, refrigerants Use property tables Air, helium gas, etc. Use ideal gas law and specific heats. Enthalpy H = U + PV h = u + Pv
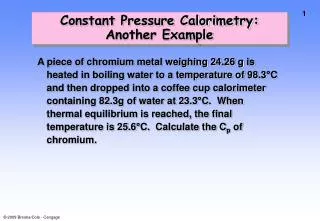
Example We have 30 l of water in a piston. The initial temperature is 40°C and the pressure is kept constant at 500 kPa. We now heat the water (still at constant pressure) until all water is in the vapor phase. We keep heating the vapor further until the volume is has expanded to 30 m3. • What is the temperature of the water vapor at the point where everything has just turned into vapor? • What is the temperature when the water vapor has expanded to 30 m3? • What is the change in enthalpy between the initial and final states ? Initially, the water is in the compressed liquid state; 500 kPa is well above the saturated vapor pressure at 40°C. By adding heat we keep increasing the temperature until we hit the coexistence curve. At that point T = Tsat(500 kPa) = 152 °C. Adding more heat leads to gradual evaporation of the liquid (at constant temperature.) The final temperature we get from the superheated vapor table. We know P= 500 kPa. Looking in that section of the table we see that v≈ 1 m3/kg when we reach T = 800°C V Enthalpy change: We approximate the properties of the compressed liquid with those of saturated liquid at 40°C h1 = hf(40°C) = 167.5 kJ/kg When everything has just turned into vapor we have h2 = hg(500 kPa) = 2748.1 kJ/kg And at P= 500 kPa, T= 800°C we find h3=4158.4 kJ/kg. To get the total enthalpy change we multiply the change in the specific enthalpy by the mass of the fluid, which we find from the initial conditions. M = V/v.
Use of tables Saturated T P, vf, vg, uf, ug, etc. P T, vf, vg, uf, ug, etc. but also uf T, P, vf, vg, uf, ug, etc. Superheated vapor you need to know two properties (T,P) or (T,u) or (P,v) etc.
Steady flow work The first Tds-equation: Tds = du + Pdv Enthalpy: h = u + Pv dh =du + Pdv +vdP The second Tds-equation: Tds = dh - vdP
Reversible steady flowand compression work Steady flow: dh = δqin– δwout Reversible: δqin = Tds dh = Tds– δwout But also: dh = Tds + vdP So: δwout = -vdP wout= -∫vdP wcomp= ∫vdP
Why does this matter? wout= -∫vdP compressing a gas requires much more work than compressing a liquid ! In a Rankine (steam) cycle we compress liquid and expand vapor. For liquids, v ~ constant wcompression= vΔP
Steam quality The purpose of a turbine is to convert enthalpy into work. From that point of view, steam with a large enthalpy is good. On expansion, the pressure and temperature of the steam drop, and some may condense. The specific enthalpy of the liquid is much smaller than the specific enthalpy of the vapor. The (mass) fraction of the vapor is called the “quality” of the steam, x. The remaining fraction, (1-x) is liquid. To calculate any property of a mixture of liquid and vapor, e.g. the specific enthalpy h = xhg+ (1 – x)hf. The subscripts g and f stand for the gas/vapor and fluid/liquid phases.
Figures come mainly from Thermodynamics by Y.A Cengel and M.A. Boles