Download
1 / 19
190 likes | 414 Views
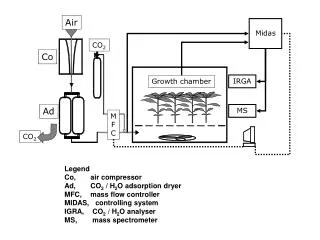
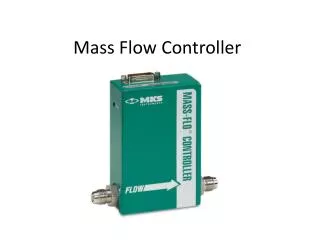
Air. Midas. CO 2. Co. IRGA. Growth chamber. Ad. MS. M F C. CO 2. Legend Co, air compressor Ad, CO 2 / H 2 O adsorption dryer MFC, mass flow controller MIDAS, controlling system IGRA, CO 2 / H 2 O analyser MS, mass spectrometer. Position A ‚Flushing‘.

E N D
Air Midas CO2 Co IRGA Growth chamber Ad MS M F C CO2 Legend Co, air compressor Ad, CO2 / H2O adsorption dryer MFC, mass flow controller MIDAS, controlling system IGRA, CO2 / H2O analyser MS, mass spectrometer
Position A ‚Flushing‘ Position B ‚Sampling‘ Growth Chamber Growth Chamber Waste Waste To GC- Column/MS To GC- Column/MS Sample Loop Sample Loop He-Carrier He-Carrier
Inlet Outlet Measurements and Calculations (ppm)
Measurements and Calculations NCE = I - O
Measurements and Calculations Outlet Inlet
Measurements and Calculations d13C of the net CO2 exchanged by a sunflower canopy during a diurnal cicle. Dark period indicated by the black bar
Measurements and Calculations D13C of a sunflower canopy during a 16-h light period
Measurements and Calculations D13C = 4.3 + 1.4 * NCE D13C = 4.3 + 1.4 * NCE D13C as a function of NCE of a sunflower canopy during the last 5 h of a 16-h light period
Canopy structure / species composition d13C of the net CO2 exchanged by a C3-dominated P. dilatatum/L. perenne canopy. Dark periods indicated by black bars.
Canopy structure / species composition d13C of the net CO2 exchanged by a C4-dominated P. dilatatum/L. perenne canopy. Dark periods indicated by black bars.
Labelling Dark period dI unlabelled dNCE –63.8‰ dI expected dNCE –19.5‰ dNCE (estimated from D13C before labelling) measured dNCE –41.5‰ • 50% of C respired during dark was fixed before labelling Lolium perenne grown at dI –49‰ labelled with dI –2‰
Labelling dI Light period unlabelled dNCE –67.7‰ dI expected dNCE –23.5‰ dNCE (estimated from D13C before labelling) measured dNCE –14.0‰ Lolium perenne grown at dI –49‰ labelled with dI –2‰
Labelling NCE = I - O NCE = A - R dAdRdNCE before labelling during labelling dA>>dR =>dNCE >dA • Respiration of unlabelled C during the labelling light period causes dNCE to be less negative, i.e causes a decrease in apparent D13C
Isotopic disequilibrium dI dNCE • d13C of the net CO2 exchanged by a alfalfa canopy established outdoors and after defoliation grown at dI –47‰. Dark periods indicated by black bars. • Respiration of unlabelled C during the light period causes dNCE to be more negative, i.e causes an increase in apparent D13C
Response of canopy-D to changing growth conditions CO2 response of canopy-D13C of sunflower.
Labelling / Isotopic disequilibrium In what direction did D13C change Interpretation of gas exchange data under conditions of isotopic disequilibrium What is the pool size that is affected What is the turnover rate of the affected pool
Inlet Shoot Outlet Shoot Outlet Root
Organ specific differences in D13C Alfalfa grown at different light intensities


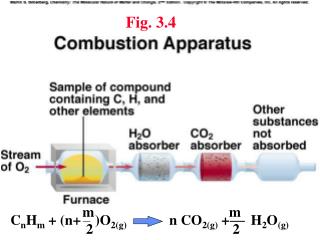


![[SO 2 + H 2 O H 2 SO 3 ] SO 3 + H 2 O H 2 SO 4 CO 2 +H 2 O H 2 CO 3](https://cdn2.slideserve.com/4275035/slide1-dt.jpg)