Download

1 / 18
180 likes | 300 Views
The world's population is projected to grow from approximately 6 billion in 2000 to 7.1 billion by 2015, with low- and middle-income countries accounting for six-sevenths of this increase. This rapid growth raises important questions about standards of living and environmental sustainability. How does the U.S. census collect population data? Discover demographic maps, the significance of the U.S. population clock, and the latest census results, revealing the dynamics of populations across states and the factors influencing growth rates.

E N D
Population Maps website for additional info
Check this out • Population Growth Rate Highlights • There will be more than 1 billion more people in the world in 2015 than in 2000. How many years is that from now? • Population will grow from about 6 billion to 7.1 billion. • Six out of seven of these people will live in low- and middle-income countries. Why do you think that is? • Population growth can make it more difficult to raise standards of living in some countries and can put pressure on the environment. Why do you think that is?
Questions to Ponder • What is population? • How do you think the US government gathers that information? • Others?
Census • This past year a census was taken of the whole country to see how many people lived in the entire United States of America. • Updated results-U. S. census home page • What is the population clock? • What is the participation rate? • How does the US rank in population in the world? • Answer • http://en.wikipedia.org/wiki/List_of_countries_by_population
According to the U.S. Bureau of the Census, the resident population of the United States, projected to 09/16/10 at 04:40 UTC (EST+5) is 310,258,504 COMPONENT SETTINGS FOR SEPTEMBER 2010 • One birth every.................................. 7 seconds One death every.................................. 13 seconds One international migrant (net) every............ 36 seconds Net gain of one person every..................... 11 seconds
The U.S. population clock is based on the national population estimates. The U.S. Census Bureau produces national population estimates annually using the latest available data on births, deaths, and international migration. • Each year, we recalibrate the population clock when we release the new set of population estimates. • For more information on the methodology for producing national estimates, see http://www.census.gov/popest/topics/methodology/2008-nat-meth.pdf [PDF].
How many people do you think live here in Tennessee? • TN Population • The 2009 population estimate for Tennessee is 6,296,254.
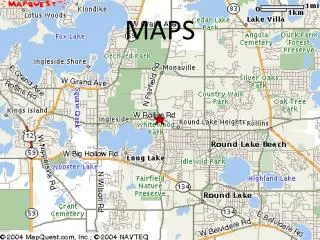
There are many types of population maps. What do you notice? Think T-K-O. Title Key Objective Title Objective/Purpose Of Chart, Graph, or Map Key
Objective=Question Which state has the highest percentage of Hispanics as a part of its state’s population? What do you notice? Think T-K-O. Title Key Objective Title Key
Objective-Question? • The Hispanic population in the United States increased from 9 million to 20 million people between 1970 and 1990. Studying the population map, which state has the highest percentage of Hispanics as a part of its state’s population? • A. New York • B. Nevada • C. New Mexico • D. California
What region of the United States has the lowest population density according to the map above? Objective/Purpose Of Map Title What do you notice? Think T-K-O. Title Key Objective Key A. northeast B. southeast C. southwest D. midwest
1. What region of the United States has the lowest population density according to the map above? • A. northeast • B. southeast • C. southwest • D. midwest • 2. Besides land area, what other factor has caused the population density rate to continue to be high in the northeast region of the United States? • A. The climate is even year round and attracts many people. • B. Natural resources needed to run businesses are plentiful in this region. • C. This region has many cattle farms to produce meat for the growing population. • D. There are many attractions and entertainment options in this region.
What do you notice about this map? • A different population map • Which statement is supported by the map above? • F Pennsylvania had the largest population in the United States in 2000. • G California experienced greater population growth than Pennsylvania by 2000. • H Laborers moved from Pennsylvania to California to work in factories in 1900. • J Large numbers of people moved to Pennsylvania to work on farms in 1900.
TKO What do you notice? • Population chart -pg. 152 • Based on the information in the chart, which of these counties had the lowest rate of growth from 1990 to 2000? • F Anderson • G Bedford • H Davidson • J Haywood
TKO • Population Map-pg. 122 • Which numbered region on the map above had the smallest population increase from • 1990 to 2006? • A 1 • B 2 • C 3 • D 4
Historical National Population Estimates • Think TKO
Make a conclusion about this map. Write three sentences about what you notice.