Download
1 / 24
260 likes | 654 Views
URBAN ROAD DESIGN Chapter 3- capacity and service level. School of Civil Engineering. 4 March 2013. 需要. 累计交通量. 容量. 时刻. 交通阻塞发生示意图. 容量増加. 通行能力是道路系统规划、设计、建设、管理的指南针 通过交通需求与通行能力比较,可以评价道路交通服务水平. 阻塞消除. 阻塞发生. 阻塞消除. Outlines. Capacity; LOS; Service flow rates Relationship between them

E N D
URBAN ROAD DESIGN Chapter 3- capacity and service level • School of Civil Engineering 4 March 2013
需要 累计交通量 容量 时刻 交通阻塞发生示意图 容量増加 • 通行能力是道路系统规划、设计、建设、管理的指南针 • 通过交通需求与通行能力比较,可以评价道路交通服务水平 阻塞消除 阻塞发生 阻塞消除
Outlines • Capacity; LOS; Service flow rates • Relationship between them • Type of the parameters • Calculation of the parameters • Control limits in the pecification
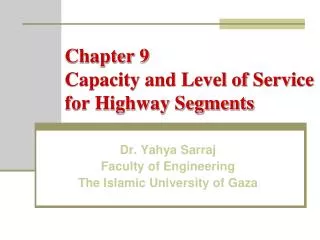
Capacity • The capacity of a facility is the maximum hourly rate at which persons or vehicles reasonably can be expected to traverse a point or a uniform section of a lane or roadway during a given time period under prevailing roadway, traffic, and control conditions. • Vehicle capacity is the maximum number of vehicles that can pass a given point during a specified period under prevailing roadway, traffic, and control conditions. This assumes that there is no influence from downstream traffic operation, such as the backing up of traffic into the analysis point.
Capacity • Person capacity is the maximum number of persons that can pass a given point during a specified period under prevailing conditions. Person capacity is commonly used to evaluate public transit services, high-occupancy vehicle lanes, and pedestrian facilities. • Prevailing roadway, traffic, and control conditions define capacity; these conditions should be reasonably uniform for any section of facility analyzed. Any change in the prevailing conditions changes the capacity of the facility.
Capacity • Persons per hour, passenger cars per hour, and vehicles per hour are measures that can define capacity, depending on the type of facility and type of analysis. • The concept of person flow is important in making strategic decisions about transportation modes in heavily traveled corridors and in defining the role of transit and high-occupancy vehicle priority treatments. • Person capacity and person flow weigh each type of vehicle in the traffic stream by the number of occupants it carries.
LOS • Level of service (LOS) is a quality measure describing operational conditions within a traffic stream, generally in terms of such service measures as speed and travel time, freedom to maneuver, traffic interruptions, and comfort and convenience. • Six LOS are defined for each type of facility that has analysis procedures available. Letters designate each level, from A to F, with LOS A representing the best operating conditions and LOS F the worst. Each level of service represents a range of operating conditions and the driver's perception of those conditions. Safety is not included in the measures that establish service levels.
Service flow rates • The service flow rate is the maximum hourly rate at which persons or vehicles Service flow rate defined reasonably can be expected to traverse a point or uniform segment of a lane or roadway during a given period under prevailing roadway, traffic, and control conditions while maintaining a designated level of service. • The service flow rates generally are based on a 15-min period. • Typically, the hourly service flow rate is defined as four times the peak 15-min volume. • Most design or planning efforts typically use service flow rates at LOS C or D, to ensure an acceptable operating service for facility users.
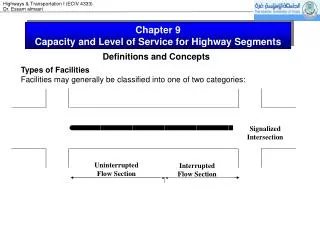
Basic conditions • Base conditions assume good weather, good pavement conditions, users familiar Base conditions defined with the facility, and no impediments to traffic flow. • Examples of base conditions for uninterrupted-flow facilities and for intersection approaches are given below.
Facilities are classified into two categories of flow: uninterrupted and interrupted. Uninterrupted-flow facilities have no fixed elements, such as traffic signals, that are external to the traffic stream and might interrupt the traffic flow. • Interrupted-flow facilities have controlled and uncontrolled access points that can interrupt the traffic flow. These access points include traffic signals, stop signs, yield signs, and other types of control that stop traffic periodically (or slow it significantly), irrespective of the amount of traffic. • Uninterrupted and interrupted flows describe the type of facility, not the quality of the traffic flow at any given time. A freeway experiencing extreme congestion, for example, is still an uninterrupted-flow facility because the causes of congestion are internal.
Base conditions for uninterrupted-flow facilities include the following: • • Lane widths of 12 ft, • • Clearance of 6 ft between the edge of the travel lanes and the nearest obstructions or objects at the roadside and in the median, • • Free-flow speed of 60 mi/h for multilane highways, • • Only passenger cars in the traffic stream (no heavy vehicles), • • Level terrain, • • No no-passing zones on two-lane highways, and • • No impediments to through traffic due to traffic control or turning vehicles. • Base conditions for intersection approaches include the following: • • Lane widths of 12 ft, • • Level grade, • • No curb parking on the approaches, • • Only passenger cars in the traffic stream, • • No local transit buses stopping in the travel lanes, • • Intersection located in a noncentral business district area, and • • No pedestrians.
Road conditions • Roadway factors include the following: • • Number of lanes, • • The type of facility and its development environment, • • Lane widths, • • Shoulder widths and lateral clearances, • • Design speed, • • Horizontal and vertical alignments, and • • Availability of exclusive turn lanes at intersections.
Traffic conditions • Traffic conditions that influence capacities and service levels include vehicle type and lane or directional distribution. • The entry of heavy vehicles—that is, vehicles other than passenger cars (a category that includes small trucks and vans)—into the traffic stream affects the number of vehicles that can be served. Heavy vehicles are vehicles that have more than four tires touching the pavement.
Directional distribution has a dramatic impact on two-lane rural highway operation, which achieves optimal conditions when the amount of traffic is about the same in each direction. • Capacity analysis for multilane highways focuses on a single direction of flow. Nevertheless, each direction of the facility usually is designed to accommodate the peak flow rate in the peak direction. • Typically, morning peak traffic occurs in one direction and evening peak traffic occurs in the opposite direction. • Lane distribution also is a factor on multilane facilities. Typically, the shoulder lane carries less traffic than other lanes.
Control conditions • For interrupted-flow facilities, the control of the time for movement of specific traffic flows is critical to capacity, service flow rates, and level of service. The most critical type of control is the traffic signal. • The type of control in use, signal phasing, allocation of green time, cycle length, and the relationship with adjacent control measures affect operations.
Technology • Emerging transportation technologies, also known as intelligent transportation systems (ITS), will enhance the safety and efficiency of vehicles and roadway systems. • ITS strategies aim to increase the safety and performance of roadway facilities. • For this discussion, ITS includes any technology that allows drivers and traffic control system operators to gather and use real-time information to improve vehicle navigation, roadway system control, or both.
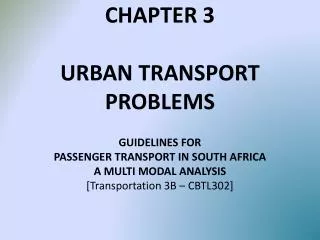
Outlines • General • Freeway • Interchanger ramp • Other urban road • Bicycle lane • Pedestrian facility
道路通行能力的分类 • 基本通行能力basic capacity 公路的某组成部分在理想的道路、交通、控制和环境条件下,一条车道的一横断面上,不论服务水平如何,1h所能通过标准车辆的最大辆数(pcu)→通常以高速公路上观测到的最大交通量为基准(理想、理论通行能力) • 可能通行能力possible capacity 公路的某组成部分在实际的道路、交通、控制及环境条件下,一条车道的一横断面上,不论服务水平如何,1h所能通过的车辆的最大辆数(pcu)→是现实条件道路上的最大交通量(实际通行能力) • 设计通行能力design capacity 公路的某组成部分在预测的道路、交通、控制及环境条件下,一条车道的一横断面上,在指定的设计服务水平下,1h所能通过的车辆的最大辆数(pcu)→是道路规划、设计的依据(实用通行能力)
三者间的关系 设计通行能力 指定服务水平下的V/C比 可能通行能力 各种修正系数 基本通行能力
服 务 水 平 • 服务水平(Level of Service)描述交通流内的运行条件以及影响驾驶员和乘客感受的一种质量标准。 • (美国)六级服务水平A — B — C — D — E — F速度高、密度小⇔速度低、密度大 舒适度高 ⇔ 舒适度低 • (中国)四级服务水平一级——二级——三级——四级A B C D E F • 服务交通量 不同服务水平下要求通过的交通量。服务水平高,服务交通量小,反之亦然。 • 最大服务交通量 每一服务水平有其服务质量的范围,服务水平最差时对应的交通量称为最大服务交通量。
LOS I LOS II LOS IV LOS III 我国分为四级:一级、二级、三级、四级。
运行质量 服务水平 基本路段通行能力 • 高速公路基本路段的基本通行能力2000 2000 1900 1800 ↑ ↑ ↑ ↑设计速度(km/hr) 120 100 80 60 • 最大服务交通量 (pcu / hr·lane) Mservicei = CB· ( V / C )i 最大服务交通量 = 基本通行能力×服务水平 • 单向车道的可能通行能力 CP = CB· N · fW · fHW · fP • 单向车道的设计通行能力 • CD = CB · ( V / C )i · N · fW · fHW · fP Mservicei最大服务交通量 N 单向车道数fW 车道宽度和侧向净空影响修正系数fHW大型车混行影响修正系数fP 驾驶员条件影响修正系数 运行质量