Download
1 / 19
190 likes | 317 Views
Stratification on the Eastern Bering Sea Shelf, Revisited. 1 Pacific Marine Environmental Laboratory, Seattle, WA 2 University of Washington, Seattle, WA 3 University of Alaska, Fairbanks. C. Ladd 1 , G. Hunt 2 , F. Mueter 3 , C. Mordy 2 , and P. Stabeno 1.

E N D
Stratification on the Eastern Bering Sea Shelf, Revisited 1Pacific Marine Environmental Laboratory, Seattle, WA 2University of Washington, Seattle, WA 3University of Alaska, Fairbanks C. Ladd1, G. Hunt2, F. Mueter3, C. Mordy2, and P. Stabeno1 Support from NOAA/NPCREP, NPRB and NSF
Motivation • Stratification associated with changes in zooplankton community (Coyle, et al. 2008) • Weak stratification (1999): large zooplankton; • Strong stratification (2004): small zooplankton • Summer productivity negatively influenced by high stratification (Sambrotto, et al. 2008; Strom and Fredrickson, 2008) • Stronger stratification (2004) associated with nutrient limitation, reduced microzooplankton grazing, and weak trophic coupling (Strom and Fredrickson, 2008)
; Stratification Index Potential energy relative to the mixed state (J/m2) can be used as an index of stratification (Simpson et al.,1978): For a vertically mixed system, SI = 0; while SI becomes increasingly positive for increasingly stable stratification.
Strength of Stratification in 2008 EarlySpring Late Summer Summer
70m isobath transect Inner middle Mooring 2 outer
70m Isobath Transect(summer 2008) South North • 2-Layer structure • Stratification stronger in North • Salinity stratification dominates in North/ temperature dominates in South Stratification Index Due to Salinity Due to temperature Temperature (color); density (black contours) Salinity (color); density (black contours) Distance (km)
Depth-Integrated Temperature Anomaly Cold Warm M2 Temperature vs. Stratification • CTD data (blue stars) confirm that stratification calculated from M2 is good • Lower stratification before 2002 (other than 1997) • High/low stratification years do not align with warm/cold years
Seasonal Cycle 1997, 2003-2005, 2007 1998-2001
Seasonal and interannual variability • Significant trend toward later stratification breakdown in the fall (2.5 days later per year) • Stronger max stratification after 2002 (marginally significant)
Stratification vs. Pollock recruitment Hypothesis: Stock-recruit residual R2 =0.74 P < 0.001 95% CI Stability index (J m-2) (Computed from observations at Mooring 2)
Using proxy for Jul-Sep stratification at M2 from 1-D model 1963-2007Relationshipbreaks down 0.4 0.2 0.0 Stock-recruit residual -0.2 -0.4 R2 =0.51 P = 0.008 95% CI -0.6 -0.8 3000 3500 4000 4500 5000 5500 Stability index (proxy)
Conclusions • Interannual variability in stratification is not associated with warm vs. cold years (salinity stratification plays a role in interannual variability) • Salinity plays more of a role in stratification on the southeast middle shelf than originally thought • Winds, heat flux, tidal mixing all contribute to timing of spring stratification set-up • Wind mixing is primary determinant in timing of stratification break-down (modulated by stratification strength) • Stratification appears to influence pollock recruitment in recent 15 years of observations, but may not have strong influence over longer time period (influence of temperature on prey may be more important)
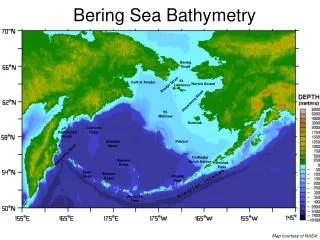
Bering Sea • Wide shelf (>500 km) • 3 shelf domains (coastal, middle shelf, and outer shelf) • Marginal Ice zone • Sea ice, temperature, stratification important to ecosystem Seasonal Sea Ice outer inner middle
1D Potential Energy Balance = rate of heat input (NCEP) = tidal current speed near bottom (M2 data) = wind speed (NCEP) Multiple regression analysis of 2005 data indicates that during the spring,heating, tidal currents, and winds are all important in predicting changes in stratification
Interannual variability in summer stratification • Correlations with heat flux, winds, tides not significant • But 1D model does a pretty good job (mean summer stratification index is significantly correlated) • Implying that the day-to-day variations matter – can’t use seasonal averages Data Model • Sharples 1D model (has been used in studies of the North Sea, e.g. Sharples et al, 2006) • Forced by tides, NCEP meteorology • Tidal amplitudes calculated from M2 • January 1 temperature estimated from St Paul air temperatures
Strength of Stratification (calculated over top 60m) Dominance of Temperature vs. Salinity Early spring: stratification very weak, dominated by salinity (temperature effect mostly unstable) Summer: stronger stratification in north (salinity), weaker in south (temperature) Late summer: stratification has strengthened especially in north due to temperature, outer shelf strat dominated by salinity
2005 • Steady increase in stratification • positive heat flux • Low wind speeds • Low tidal currents • allows for incr. Chl • Spring bloom starts first week of May • Positive heat fluxes • Low wind speeds • Low tidal currents • Decrease in stratification • Low heat flux • Higher wind speeds • Results in new nuts and incr. Chl
Mooring 2(2005) • 2-Layer structure • Stratification dominated by temperature but salinity has some influence • Max stratification in August; breakdown in October • Influence on nutrient and chlorophyll concentrations