Download
1 / 48
480 likes | 764 Views
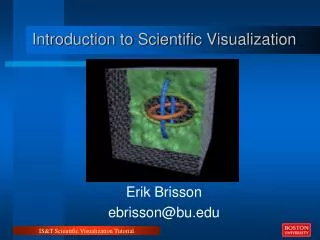
Introduction to Scientific Visualization with VTK. November 16 University of Chicago, CS-341. Terrence L. Disz Math and Computer Science Division Argonne National Laboratory disz@mcs.anl.gov. Visualization. Interpreting data in visual terms Data is too complex Too much data

E N D
Introduction to Scientific Visualization with VTK November 16 University of Chicago, CS-341 Terrence L. Disz Math and Computer Science Division Argonne National Laboratory disz@mcs.anl.gov
Visualization • Interpreting data in visual terms • Data is too complex • Too much data • Not a substitute for statistical analysis, sampling, filtering and other quantitative methods • Make use of human sensory abilities • Pattern Recognition • Trend discovery
We are interested in more complex data • Multi-dimensional • Complex geometry • Computed or collected • Simulations • MRI, CAT, etc • Microscopic to Galactic data collections
Some examples Nuclear, Quantum, and Molecular Modeling Structures, Fluids and Fields Advanced Imaging and Data Management
More Examples Surface Rendering with vTK Volume Rendering with SGI Infinite Reality Engine
Even More Examples: Astro Physics
Some Clarification • Imaging • Computer Graphics • Visualization • Virtual Reality • Stereo 3D, Immersion, User tracking
Large Scale Virtual Reality Projection Wall The CAVE Immersadesk
Imaging, or Image Processing • Digital Image - set of discrete sample points • Picture elements (Pixel) • Gray level value • Captured or computer generated • Represents a continuous function • Processing • Edge detection, Feature extraction • Contrast enhancement • Projections, transformations
Image Processing; Edge Detection Original Image Vertical Edges Norm of the gradient Horizontal Edges http://robotics.eecs.berkeley.edu/~mayi/imgproc/cademo.html
Computer Graphics • Creating images with a computer - Paint and draw Red Boots Tom Nast Run Run Run Douglas Lockyer Paper Cranes George Ho
Computer Graphics • Creating images with a computer - 3d © 1998 Pixar Animation Studios, All Rights Reserved. www.pixar.com http://www.websharx.com:80/~dfarmer/gallry1.htm
Computer Graphics • Components • Model • Geometry • Surface properties • Objects or abstract volumes • Lighting • Number, position, properties • Viewpoint • Projection
Rendering • Converting graphical data into images • Visualization • Transforms data into graphical data (primitives) • Points, triangles, etc • Graphical primitives are rendered • Image rendering, Object rendering, Volume rendering
Image Based Rendering • Painters Algorithm • Draw polygons from back to front • Scan Line • Look through each pixel to find first ploygon intersected • Z-buffer • Assign z-value to each polygon, draw closest one, pixel by pixel
Object Based Rendering: Ray Tracing http://gandalf.iuk.tu-harburg.de/hypgraph/raytrace/rtrace1.htm
Volume Rendering • Displays all of the 3-D data at once, like an X-ray: Denser parts are more opaque. • User controls the density of various data values.
Computer Graphics: Coordinate Systems • Model • local coordinate system • World • Where the models are placed • View • Logical Image Plane • Display • X,Y Pixel locations
Computer Graphics: Transformations Translation Scaling Rotation
Transformation Matrix To translate the point (x,y,z) by the vector (tx, ty, tz) Transformation Matrix for Translation
Scaling, Rotation Rotate about x Scaling Matrix
Visualization is more than computer graphics • Data is 3 Dimensional or greater • Data transformations occur frequently • Feedback from vis system causes data transformations • Interactive • Exploration, discovery, understanding
Using VTK for Scientific Visualization • The VisualizationToolkit, 2nd edition • Schroeder, Martin, Lorenson • Prentice Hall • VTK Software • http://www.kitware.com/vtk.html • Software, book, FAQ’s, discussion lists, examples, etc • /opt/courses/anl/vtk • graphics/examplesCxx
VTK - An OO Scientific Visualization, Processing and Graphics System • The VTK Model - a visualization pipeline Data Object Process Object Display (Computational Methods, Measured Data) Source Filter Mapper Procedural, Reader Transforms the data Creates Geometric Primitives
The VTK Model - A simple example Sphere Source Elevation Filter Mapper vtkSphereSource *sphere = vtkSphereSource::new(); vtkElevationFilter *colorIt = vtkElevationFilter::New(); colorIt->SetInput(Sphere->GetOutput()); vtkDataSetMapper *mapper = vtkDataSetMapper::New(); mapper->SetInput(colorIt->GetOutput()); vtkActor *actor = vtkActor::New(); actor->SetMapper(mapper);
Data Representation - Cells & Points • Topology • Shape such as triangle, tetrahedron • Geometry • Point Coordinates assigned to a topology • Data Attributes • Data associated with topology or geometry
Vertex Polyvertex Line Polyline Triangle Triangle Strip Quadrilateral Polygon Tetrahedron Hexahedron Voxel Cells specify Topology
Cells • Cell is defined by an ordered list of points • Triangle, quadrilateral points specified counter clockwise • Others as shown 6 3 7 5 4 1 3 2 2 Hexahedron 1 Tetrahedron 0 0
Meshes are made of Cells • Cells can be many different shapes and sizes • e.g. in 2D: Triangles, Quadrilaterals, etc • e.g. in 3D Tetrahedra, Hexahedra, Pyramids, etc. • Meshes can consist of one or more types of cells Quadrilateral Prism Triangle Tetrahedron Hexahedron Mesh
VTK Dataset Types • vtkStructuredPoints • vtkRectilinearGrid • vtkStructuredGrid • vtkPolyData • vtkUnstructuredGrid • Methods for reading and writing
Datasets • Organizing structure plus attributes • Structured points • Rectilinear Grid • Structured Grid
Unstructured Grid A collection of vertices, edges, faces and cells whose connectivity information must be explicitly stored
How are unstructured meshes different than regular grids? • Regular Grids • e.g., Cartesian grids, logically rectangular grids • mesh info accessed implicitly using grid point indices • Efficient in both computation and storage • typically use finite difference discretization • Unstructured Meshes • mesh connectivity information must be stored • Incurs memory and computational cost • handles complex geometries and grid adaptivity • typically use finite volume or finite element discretization • mesh quality becomes a concern
Data Attributes Assigned to points(VTK) or cells • Scalars • Vector • Magnitude and direction • Normal • a vector of magnitude 1 • Used for lighting • Texture Coordinate • Mapping data points into a texture space • Tensor
1 10 4 8 Visualization of Attributes • Scalar • Color Mapping • Countouring • 3D Isosurface Contour Value of 5
Visualization of Attributes • Vectors • Oriented Lines • Oriented Glyphs • Streamlines
The VTK Model - a visualization pipeline Data Object Process Object Display (Computational Methods, Measured Data) Source Filter Mapper Procedural, Reader Transforms the data Creates Geometric Primitives
Some Transformations • Decimation • Reduce polygon count, preserving topology
Some Transformations • Contouring • Create boundaries (contours) between regions • Triangulate • Create topology from unstructured points
#include "vtk.h" main () { vtkRenderer *renderer = vtkRenderer::New(); vtkRenderWindow *renWin = vtkRenderWindow::New(); renWin->AddRenderer(renderer); vtkRenderWindowInteractor *iren = vtkRenderWindowInteractor::New(); iren->SetRenderWindow(renWin); vtkSphereSource *sphere = vtkSphereSource::New(); sphere->SetPhiResolution(12); sphere->SetThetaResolution(12); vtkElevationFilter *colorIt = vtkElevationFilter::New(); colorIt->SetInput(sphere->GetOutput()); colorIt->SetLowPoint(0,0,-1); colorIt->SetHighPoint(0,0,1); vtkDataSetMapper *mapper = vtkDataSetMapper::New(); mapper->SetInput(colorIt->GetOutput()); vtkActor *actor = vtkActor::New(); actor->SetMapper(mapper); renderer->AddActor(actor); renderer->SetBackground(1,1,1); renWin->SetSize(450,450); renWin->Render(); A VTK PROGRAM
// interact with data iren->Start(); // Clean up renderer->Delete(); renWin->Delete(); iren->Delete(); sphere->Delete(); colorIt->Delete(); mapper->Delete(); actor->Delete(); }
Your Assignment • Use output from the 11/2 assignment or use our data • sol.22.22.22.out • Compile and run the converter program to transform the data into a vtk dataset • converter sol.22.22.22.out 22 22 22 • Compile and Run the supplied VTK vis program on the data • Sample.C
Your Assignment • Make more runs, modifying the thresholds • Add a third cutting plane and rerun your test data • Write a short report explaining what happened
Assignment Resource Location • ~disz/assignment • Sample data • makefile • converter program • Vis app