Download
1 / 9
110 likes | 500 Views
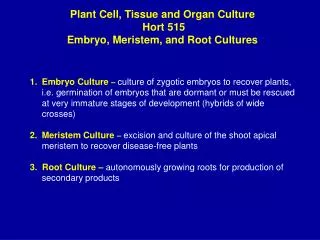
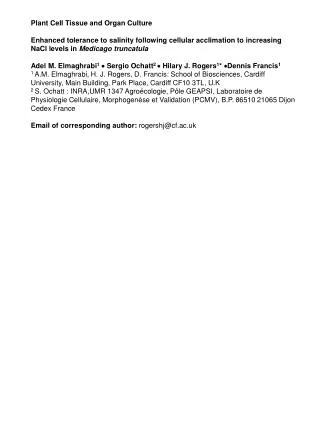
Plant Cell Tissue and Organ Culture Enhanced tolerance to salinity following cellular acclimation to increasing NaCl levels in Medicago truncatula Adel M. Elmaghrabi 1 Sergio Ochatt 2 Hilary J. Rogers 1 * Dennis Francis 1

E N D
Plant Cell Tissue and Organ Culture Enhanced tolerance to salinity following cellular acclimation to increasing NaCl levels in Medicagotruncatula Adel M. Elmaghrabi1 Sergio Ochatt2 Hilary J. Rogers1* Dennis Francis1 1 A.M. Elmaghrabi, H. J. Rogers, D. Francis: School of Biosciences, Cardiff University, Main Building, Park Place, Cardiff CF10 3TL, U.K 2 S. Ochatt : INRA,UMR 1347 Agroécologie, Pôle GEAPSI, Laboratoire de Physiologie Cellulaire, Morphogenèse et Validation (PCMV), B.P. 86510 21065 Dijon Cedex France Email of corresponding author: rogershj@cf.ac.uk
Supplementary Table 1. Optimisation of media and explant source (a) Optimising best medium and most responsive explant in terms of mean (± S.E.) percentage frequency of callus growth (n = 12). (b) Compositions of the four different media: all modified from MS (Murashige and Skoog, 1962) medium, used to optimise the ideal conditions for in vitro growth of callus derived from Medicago truncatula callus. Superscript letters indicate significant differences within each column (P < 0.05) (a) (b) Key: MANA= medium MS+NAA (as in Ochatt et al., 2000), EID= Embryo induction development MS4= MS + 4 mg/L 2,4-D, MPIC= medium MS+Picloram (as in Ochatt et al., 2000).
Supplementary Table 2. Growth of calli Monthly FW (g) during, and absolute growth rate (AGR, g m-1) following (a) 6 months at each NaCl concentration; (b) in 17 month old calli, and (c) in 23 month old calli. Within each column, means given the same super-scripted letter are not significantly different within each treatment compared with the 0 mM NaCl control. Different letters denote significant differences compared with the control (P ≤ 0.05) (a) (b) (c)
g h 50 r 0 100 150 SE a b c Embryogenesis SE SE SE SE 1mm 0.2 mm 1mm e f d SM RM Supplementary Figure 1. Representative images of calli showing various levels of organogenesis and embryogenesis response(a-c) profuse embryogenesis (arrows; SE) in healthy callus following the entire tissue culture protocol at 100 mM NaCl and transfer to ECR medium for one month at 100 mM NaCl (d) shoot morphogenesis (SM) and (e) root morphogenesis (RM) following 5 months of pre-treatment on MANA medium (Bar scale =10 mm) (f) a necrotic callus following the entire acclimation protocol at 350 mM NaCl. (Bar scale =10 mm) (g) Representative calli by the end of acclimation and subcultured for one month to ECR medium with 0, 50, 100 or 150 mM NaCl. Arrows point to somatic embryo genesis (Bar scale = 5 mm) (h) transfer of callus cultured at 100 mM NaCl from EDM to ECR medium for two months to induce roots (arrow, r; Bar scale = 1.84 mm).
0.35 a 0.3 a 0.25 0.2 FW (mg) 0.15 b b 0.1 c 0.05 c 0 0 50 100 150 250 350 NaCl treatments (mM) Supplementary Figure 2. Preliminary acclimation experiment. Mean (± S.E.) callus fresh weights (mg) following culture on MANA medium for 5 months and then sub-culture to the various NaCl treatments continuously for 3 months. Different letters above each bar compared with 0 mM indicate significant differences between treatments (P ≤ 0.05) n=12; y=0.218 -0.0007x (P = 0.002).
1600 a 1400 a 1200 1000 Osmolarity (mmoles kg-1) a b b b 800 c d c 600 d e f 400 200 0 50 100 150 250 350 0 NaCl (mM) Osmolarity of calli 409 546 725.5 761.25 1393.5 1196.33 Osmolarity of medium 338 409.4 561.6 635.4 710.6 853.2 Supplementary Figure 3. Osmolarity of calli and culture medium Mean (± S.E.) osmolarity (mmoles kg-1) in the callus tissues and in the culture medium and mean percentage (± S.E.) water content of callus tissues by the end of 6 months culture on the various NaCl concentrations.Different letters between bars of same colour indicate significant differences between treatments (P ≤ 0.05) (n=4).
a ab 60 b bc Water content (%) c c 50 46 0 50 100 150 250 350 [NaCl] (mM) Supplementary Figure 4. Water content of calli. Mean percentage (± S.E.) water content in the callus following 6 months at the various NaCl concentrations. Different letters indicate significant differences between treatments compared with 0 mM NaCl control (P 0.05, n=3)
50mM NaCl 100 5 0 counts 0mM NaCl 100 Supplementary Figure 5. Levels of endoreduplication in calli. Frequency of FCM peaks of cells from calli following 6 months of culture at the different NaCl concentrations. The in-built computation programme of the cytometer identifies peaks as G1 (2C), S-phase (>2 and < 4 C) G2 cells (4C), where 1C is the nuclear DNA amount in a gamete (n = 3000). Note a third peak indicating 8C (i.e. an onset of endoreduplication) in the 50 mM NaCl treatment, and skewing of “S-phase” cells in the 100 and 150 mM NaCl treatments (indicating an abnormally high population of nuclei undergoing DNA synthesis) and absence of the second (4C) peak in the 350 mM NaCl treatment, indicating an arrest of cell divisions (probably reflecting an onset of senescence of tissues). 100mM NaCl 100 150mM NaCl 100 250mM NaCl 100 100 350mMNaCl