Download
1 / 13
130 likes | 329 Views
A Knowledge-Based Clustering Algorithm Driven by Gene Ontology. Jill Cheng Affymetrix, Inc. Jan 15, 2004. The DAG structure of Gene Ontology. One-stop-shopping for biological information. Digraphs are computable. molecular function. molecular function. Goal.

E N D
A Knowledge-Based Clustering Algorithm Driven by Gene Ontology Jill Cheng Affymetrix, Inc. Jan 15, 2004
The DAG structure of Gene Ontology One-stop-shopping for biological information Digraphs are computable
molecular function molecular function Goal
The closer a node is to the root, the more general its biological classification, thus a greater amount of information is conveyed by higher level edges The more common parent nodes shared the higher the degree of similarity
Pair-wise similarity score between GO terms Clique Finding A weighting factor (wt) was assigned to each edge as a function of the depth (n) in the digraph, I chose a value of 0.815 to maximize (wt6 – wt3). Determining the longest partial path shared by two nodes, Wp is the sum of weights for edges from root to level p. A partial normalization scheme was applied to factor in the unevenness of the GO digraph. Calculate the average length for all paths that go through the shared partial path (p), followed by the weight for a hypothetical path with p edges (Wp). Wp is transformed to W’p, the mean of Wp and C. The normalization factor (Nfp) is the ratio of W’p and Wp The value for a partial path with m edges (Wm) is normalized by applying Nfp.
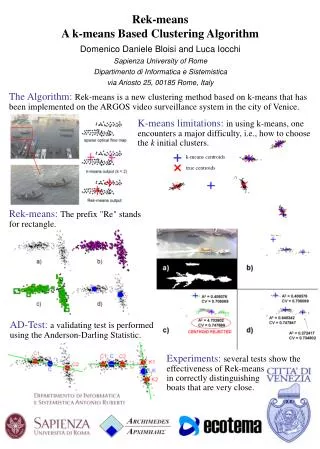
Spike-in experiment Five related GO nodes with GOids 5381, 8490, 15344, 15620, and 15621; labeled red; were spiked into a randomly selected pool of 20 nodes and subjected to GO clustering. The similarity analysis successfully re-created the set of related GO nodes. Column 1and 2 in the table shows a pair of GO nodes and column 3 shows the pair-wise similarity scores. Nodes colored pink (15342, 15359) are from the randomly selected 20 Go nodes and were clustered with the spiked GO nodes. Green circle indicates the cluster root (15291), which is the lowest level common ancestor node.
RA stimulated MPRO cell differentiation time-series experiment Transgenic Myeloid Progenitor (MPRO) cells transgenic for the dominant negative Retinoic Acid (RA) receptor were induced to differentiate into Neutrophils with high doses of RA. Gene expression at 0, 1, 2, 4, and 8 hours post RA induction was analyzed with Affymetrix U74Av2 mouse microarray. Genes showing significant changes in their expression level across a series of time points are modulated by retinoic acid stimulation and cell differentiation. We arbitrarily took the top 80 genes based on the F-score ranking.
Clique Finding GO clustering
GO clustering on Leukocyte differentiation time-series experiment
GO-guided expression clustering Hierarchical Clustering Linear combination
defense response protein modification transcription regulation 99535_at 99956_at 104598_at 103089_at 97994_at 94325_at 95586_at 104328_at 102745_at 93454_at 92286_g_at 102424_at 99491_at 160430_at 160612_at 93274_at 103033_at 93500_at 102996_at 93264_at 102401_at 96747_at 103212_at 98111_at 96810_at 100156_at 92644_s_at 103259_at 101502_at 104598_at 103089_at 102745_at 99491_at 160612_at 160430_at 102996_at 97994_at 99956_at 104328_at 92286_g_at 94325_at 95586_at 93454_at 102424_at 96747_at 99535_at 93274_at 93264_at 93500_at 103033_at 102401_at 92644_s_at 103259_at 101502_at 103212_at 100156_at 98111_at 96810_at 1 1 2 2 3 3 4 4 5 5 6 6 Hierarchical clustering GO-guided hierarchical clustering GO guided clustering on Leukocyte differentiation time-series experiment Gene clusters where correlations between biological function and expression profile are both evident were identified by GO guided clustering.
Acknowledgements John Martin Melissa Cline David Finkelstein Tarif Awad Michael Stewart Michael Siani-Rose David Kulp Thank you!