Download
1 / 37
370 likes | 495 Views
Stratospheric Ozone (con ’ t): Production, Destruction, & Trends. Antarctic Ozone Hole: Sept. 12, 2012. http://ozonewatch.gsfc.nasa.gov/. Thermal Structure of the Atmosphere. Why are the Thermosphere and Stratosphere so “ hot ” ?. Thermosphere : Photodissociation of O 2

E N D
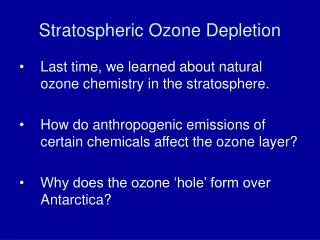
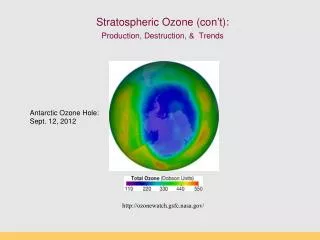
Stratospheric Ozone (con’t):Production, Destruction, & Trends Antarctic Ozone Hole: Sept. 12, 2012 http://ozonewatch.gsfc.nasa.gov/
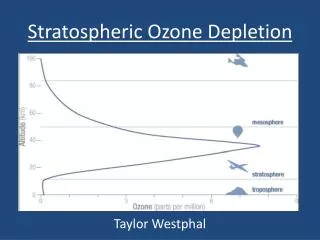
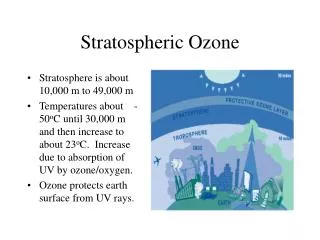
Why are the Thermosphere and Stratosphere so “hot”? Thermosphere: Photodissociation of O2 O2 + hn O + O ionization l 120-210 nm Stratosphere: Ozone production and destruction is exothermic. O2 + O O3 (production) O3 + O 2O2 (destruction) produces heat l < 310 nm
Photodissociation of Oxygen O2 + UV light (120-210 nm) --> O + O Makes “free O” for making ozone (O3) Occurs above 50 km in atmosphere (Upper Stratosphere)
Now “Good” and “Bad” Ozone
Natural Ozone Production The Chapman Profile: balancing density and photon flux
Factors controlling the rate of photodissociation 1.The wavelength of light. The wavelength must be short enough so the wave has sufficient energy to break the bond between the two atoms in the oxygen molecule. The most efficient wave lengths for photodissociation occur in the ultraviolet (0.15µm). 2.Variation of oxygen density. As altitude increases oxygen density decreases (Chapman Profile). The higher the oxygen density the greater the likelihood of having an interaction between an oxygen molecule and a photon. 3.Variation of photon flux Photon flux decreases with decreasing altitude because of photon absorption by the atmosphere. Rate of photodissociation of oxygen is greatest at an altitude of about 100 km:
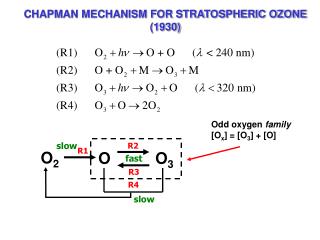
The Chapman Cycle 1930s, Sydney Chapman proposed a series of reactions to account for the ozone layer: the Chapman Cycle The Chapman Cycle explains how the ozone layer is formed and maintained. Describe this process in some detail. Four chemical reactions: • Initiation O2 + light 2O (120 – 210 nm) • Propagation (cycling) O + O2 + M O3 + M* (exothermic) O3 + light O2 + O (220 – 320 nm) • Termination O3 + O 2O2 (exothermic)
The Chapman CycleOxygen-only Chemistry “odd-oxygen” species (Ox) are rapidly interconverted Ox = O + O3
DU: Ozone measurement unit Dobson Unit (100 DU = 1 mm O3 at STP)
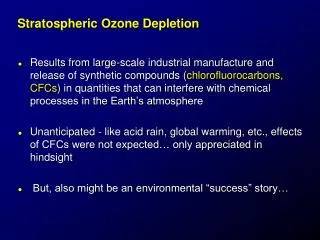
Rowland & Molina & Crutzen (1974) Discovered that CFCs can last 10-100s of years in atmosphere. CFCs susceptible to break down by UV Predicted that CFCs will reduce ozone inventories. Proof that this was occurring came in 1985. Montreal Protocol 1987 Nobel Prize (1995)
A Brief History • June 28, 1974, Drs. Sherry Rowland and Mario Molina published the first study warning that CFCs could harm the ozone layer (Molina and Rowland, 1974). • They calculated that if CFC production continued to increase it would cause a global ozone loss of 30-50% loss by 2050. (current number is 70%!). • They warned that the loss of ozone would significantly increase the amount of UV-B light reaching the surface, increasing incidences of skin cancer. • Although no stratospheric ozone loss had been observed yet, CFCs should be banned. • At the time, the CFC industry was worth about $8 billion in the U.S., employed over 600,000 people directly, and 1.4 million people indirectly (Roan, 1989).
Key ingredients to make an Ozone Hole: Chlorine: supplied by manmade CFCs Cold: Antarctic Polar Vortex Seasons: Dark and Light seasons Clouds: Polar Stratospheric Clouds UV radiation: Springtime sunlight
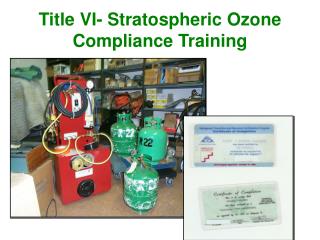
CFCs: Chlorofluorocarbons CFCs introduced 1950s “Miracle compounds”: inert, cheap, many applications. Uses: • Foam & Insulation • Propellants • Air conditioning • Electronics
Antarctic Polar Vortex Large polar land mass Ice covered, large temperature gradients Circular airflow around Antarctica APV effectively creates an atmospheric “fence” impeding air exchange with other regions (this is arctic polar vortex)
Polar Stratospheric Clouds (PSCs) Ice clouds during Austral winter (no light, very cold) PSCs concentrate, activate Cl (as Cl- and CLO) Ice crystals act as reaction sites for O3 destruction CFCs accumulate in stratosphere
O3 loss by UV photolysis Austral spring: sunlight appears, UV • UV radiation splits off Cl atom from CFC molecule • Ozone destroying reactions: Cl + O3 --> ClO + O2 ClO + O --> Cl + O2 (Cl is free to react with another O3 again) Net: O3 + O --> O2 + O2
Molina et al. (1974) Farman et al. (1985) Discovery of the Ozone HoleBritish Antarctic Survey (Farman et al 1985)
Area of the Ozone Hole http://jwocky.gsfc.nasa.gov/eptoms/dataqual/oz_hole_avg_area_v8.jpg
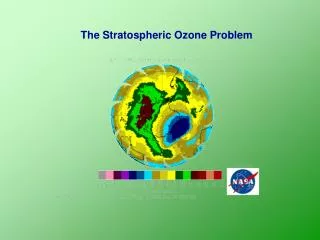
The Ozone Hole right now Antarctic Ozone Hole: Sept. 12, 2012 http://ozonewatch.gsfc.nasa.gov/
The Ozone Hole in 2007 Blue = low ozone levels
Current Status (2012) Ozone Hole Area SH Dobson units http://jwocky.gsfc.nasa.gov/eptoms/dataqual/ozone_v8.html
The world avoided… April, 70-90˚N
As over Antarctica, the ozone losses are extreme, and spread to mid-latitudes