Download
1 / 17
170 likes | 288 Views
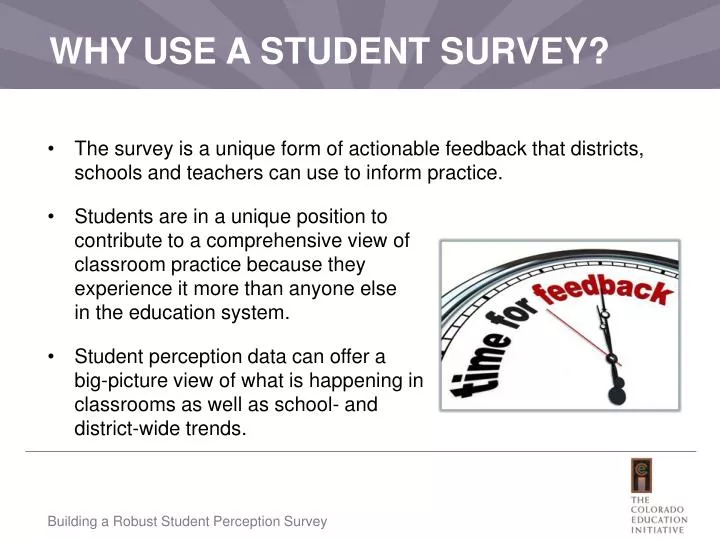
WHY USE A STUDENT SURVEY?. The survey is a unique form of actionable feedback that districts, schools and teachers can use to inform practice.

E N D
WHY USE A STUDENT SURVEY? • The survey is a unique form of actionable feedback that districts, schools and teachers can use to inform practice. • Students are in aunique position to contribute to a comprehensive view of classroom practice because they experience it more than anyone else in the education system. • Student perception data can offer a big-picture view of what is happening in classrooms as well as school- and district-wide trends. Building a Robust Student Perception Survey
WHAT THE RESEARCH SAYS… • The Measures of Effective Teaching (MET) Project had two significant findings around student perception surveys: • When student surveys are combined with observation and student growth data, these three measures tell us more and are able to predict future effectiveness better than any of them alone. • Student perception survey results are correlated to student achievement gains. • The use of student feedback has also been shown to promote both reflection and responsibility on the part of the students. For more information, see our Research overview. Bill and Melinda Gates Foundation (2012). Asking students about teaching: Student perception surveys and their implementation. (MET Project Policy and Practice Brief). Wiggins, G. (2011). Giving students a voice: The power of feedback to improve teaching. Education Horizons, 89(3), 23-26. Building a Robust Student Perception Survey
COLORADO’S STUDENT PERCEPTION SURVEY • Free and publically available • 34-item survey about student learning experiences, mapped to the Colorado Teacher Quality Standards • Two versions of the survey, grades 3-5 and 6-12 • Developed by the Colorado Education Initiative Link to the Full Technical Report Building a Robust Student Perception Survey
WHAT DOES THE SURVEY MEASURE? • Survey does measure elements of student experience that have been demonstrated to correlate most closely to student growth. • Survey does not measure whether or how much a student likes or dislikes a teacher. Building a Robust Student Perception Survey
WHAT DOES THE SURVEY MEASURE? See the full surveys for grades 3-5 and 6-12 Building a Robust Student Perception Survey
Student Feedback • Students participated in “think-alouds” where they talked through their responses to each question. • Students responded thoughtfully. • In my class, we learn things that matter to me: “She made the people who speak Spanish feel more important because we participated… we could teach about our culture. [It] taught us to trust in ourselves.” • My teacher knows when we understand the lesson and when we do not: “I say most of the time… one of my friends didn’t understand and when she asked if we all understood, he didn’t say anything [and she didn’t know and kept on going]” Building a Robust Student Perception Survey
Teacher Feedback • Over 1400 teachers provided input during the survey development process. • Focus groups, survey pre-piloting, online feedback forums • We took feedback about the instrument very seriously. • Items were changed or eliminated for specific reasons. For example between the fall and spring administration: • The item “I get bored in this class” was removed because many teachers found it troubling. • “Schoolwork in this class is too easy” was removed because it was not related to students’ responses on other items. Building a Robust Student Perception Survey
Revisions to the Colorado SPS • Removed all negatively-stated items • The fall 2012 instrument included a handful of negatively-worded items • All were removed from the final SPS instrument. • Redefined organizing elements (four mapped to TQS) • Included open-ended question Building a Robust Student Perception Survey
SPS RESULTS & EVALUATION RATINGS Classroom Community Classroom Management Student Learning Student-Centered Environment
OPEN-ENDED RESULTS • Analyzed 14,539 open-ended responses (3-5 and 6-12) • We find that not only were the majority of students taking the survey seriously, but that many of the responses were specific and actionable in nature • 98.6% (N=14,341) were considered substantive • 66.3% (N=9,646) were coded as actionable • Moreover, although some subjects and grades were slightly more likely to garner actionable feedback, in general actionable responses came from students in all grades and subjects Building a Robust Student Perception Survey
WHAT STUDENTS ARE SAYING Link to Report on Open-Ended Results Building a Robust Student Perception Survey
GUIDING PRINCIPLES FOR ADMINISTRATION • We know that teachers care about their practice and especially about their students. • They also may experience nervousness and anxiety about the surveys, and district and school leaders must address those fears. • By itself, a reliable and valid instrument does not ensure that teachers will receive good feedback. • Messaging matters! • Engage stakeholders early and often. • Make the process as transparent as possible. • Give stakeholders real decision-making power. Building a Robust Student Perception Survey
HOW TO USE SURVEY RESULTS • Considerations • “Hold-harmless” pilot year • Sharing teacher-level results • Use of results • As a formative tool • Reflect on individual practice • Identify over-arching trends and create strategies to address them. • As a part of an evaluation • Used as an artifact for determining ratings for professional practices • Included as one of several multiple measures Building a Robust Student Perception Survey
Amy Farley, Director, Research & Impact afarley@coloradoedinitiative.org; 720-502-4723
Elaine Allensworth, Consortium on Chicago School Research elainea@uchicago.edu Amy Farley, Colorado Legacy Foundation afarley@colegacy.org Kendra Wilhelm, Denver Public Schools Kendra_wilhelm@dpsk12.org Questions? @AYPF_Tweets #aypfevents