Download

1 / 39
390 likes | 605 Views
Cancer Tumor Kinetics. Gretchen A. Koch Goucher College PEER UTK 2011. Special Thanks To:. Dr. Claudia Neuhauser University of Minnesota – Rochester Author and creator of modules. Learning Objectives. After completion of this module, the student will be able to:

E N D
Cancer Tumor Kinetics Gretchen A. Koch Goucher College PEER UTK 2011
Special Thanks To: • Dr. Claudia Neuhauser • University of Minnesota – Rochester • Author and creator of modules
Learning Objectives • After completion of this module, the student will be able to: • Build a data‐driven phenomenological model of tumor growth with a minimal number of parameters • Make predictions about the kinetic behavior of a tumor based on a mathematical model • Define growth rate and exponential growth • Develop a differential equations describing tumor growth • Use WolframAlpha to solve algebraic equations and take limits
Prerequisites • Volume of a sphere • Straight lines • Natural logarithmand exponential functions • Graphing in Excel • Logarithmic transformation • Fitting a straight line to data points in Excel and displaying the equation
Knowledge Gained • Continuous time population models • Fitting a straight line to data • Doubling time of an exponentially growing population • Growth rate and exponential growth
New Cases of Cancer 2010 Map from American Cancer Society. Cancer Facts & Figures 2010. Atlanta: American Cancer Society; 2010.
Cancer Tumor Kinetics • The growth and spread of the cancer tumor • Tumor metastasis and survival rates Table from American Cancer Society. Cancer Facts & Figures 2010. Atlanta: American Cancer Society; 2010.
Case Study • Patient with breast cancer tumor and growth of (untreated) tumor over time D. v. Fournier, E. Weber, W. Hoeffken, M. Bauer, F. Kubli, and V. Barth. 1980. Growth rate of 147 mammary carcinoma. Cancer 8: 2198‐2207.
Questions to Answer • When will the patient die? • Lethal burden of tumor • When did the cancer start? • Depends on growth rate (doubling time)
Model Assumptions • The shape of a tumor is a sphere • A tumor is a solid mass of tumor cells • An individual tumor cell is a sphere with diameter • 1 gram of tumor cells corresponds to 109 cells
Create the Model: Background Information • Volume of a sphere with radius, r: • Relationship between diameter, d, and radius, r:
Create the Model • Volume of a cancer tumor, VT, with diameter, D: • Volume of individual cancer tumor cell, VC, with diameter, d:
Think, Pair, Share:Create the Model • Given the two volumes, find the number of tumor cells in any given cancer tumor. Time to Share!
Create the Model • The number of cells in any tumor is
Create the Model • The number of cells in any tumor is
Create the Model • Since 109 tumor cells weigh 1 gram, the weight of the tumor is
Think, Pair, Share:Create the Model • Download the cancer data set from the Schedule webpage. • Under the Patient 1 tab, calculate each of the following • Column G: Average diameter for the tumor of the patient • Column H: Volume of the tumor based on the average diameter • Column I: Number of cells in the tumor • Column J: Weight of the tumor Time to Share!
Create the Model • Excel Time!
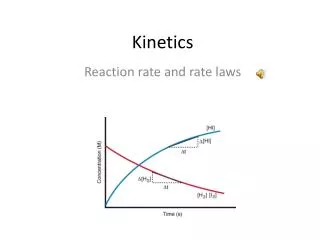
Think, Pair, Share:Kinetics Model • Under the Patient 1 tab, calculate each of the following • Column C – Days between observations: Excel can calculate the number of days between observations by using simple subtraction. Set the date of the first observation to be day 0, and calculate the days between subsequent observations. • Plot the Number of Tumor Cells (Column I) as a function of time (Column C). • Determine if transforming either or both axes logarithmically gives a straight line fit. • What type of function should we use to fit our data? Time to Share!
Kinetics Model • Excel Time!
Think, Pair, Share:Kinetics Model • Use the Trendline option to fit an exponential function to the data and on the graph, display the equation of the form • Determine and record the values of a and c. Time to Share!
Kinetics Model • Excel Time!
Think, Pair, Share:Kinetics Model • A number of studies have shown that a primary tumor starts from a single cell. Use the model equation to predict the date when the tumor started. • Tumors can be detected by palpitation when their size is about 107 to 109 cells. Tumors become lethal when their size is about 1012 to 1013 cells. This size is called the lethal burden. Based on the model equation, determine when the tumor was detectable and when the tumor reached the lethal burden? Time to Share!
Kinetics Model • Excel Time!
Doubling Time • Then, the doubling time does not depend on the number of cells present.
Doubling Time • I forget how to do this! • WolframAlpha
Think, Pair, Share:Doubling Time • Use Excel to find the doubling time for our tumor kinetics model. Time to Share!
Think, Pair, Share:Doubling Time • Excel time!
Learning Objectives • After completion of this module, the student will be able to: • Build a data‐driven phenomenological model of tumor growth with a minimal number of parameters • Make predictions about the kinetic behavior of a tumor based on a mathematical model • Define growth rate and exponential growth • Develop a differential equations describing tumor growth • Use WolframAlpha to solve algebraic equations and take limits
Putting it all together • Complete the group project on page 7 of the Cancer Tumor Kinetics pdfto find the time to lethal burden and detection time for: Data Source: Table III from Friberg, S. and S. Mattson. 1997. On the growth rates of human malignant tumors: Implications for medical decision making. Journal of Surgical Oncology 65: 284‐297