Download
1 / 10
100 likes | 233 Views
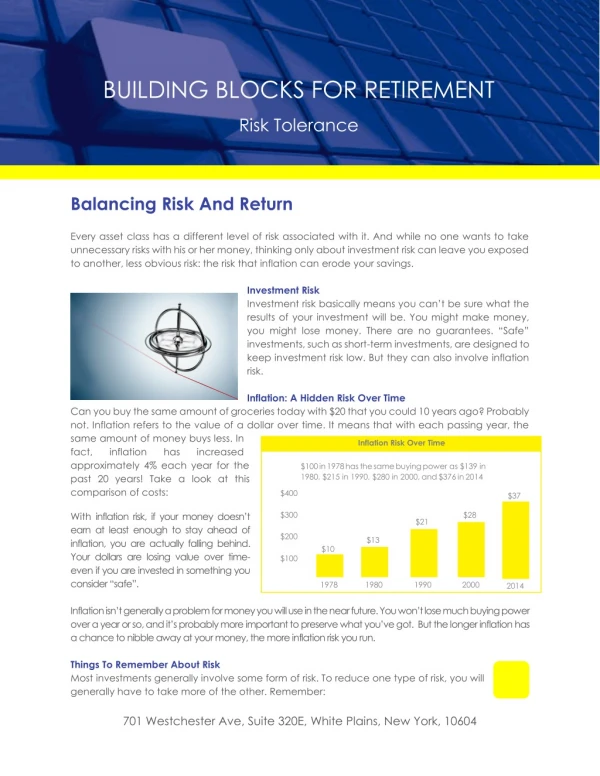
This paper discusses a framework for integrating performance and security risk models in border management systems. It emphasizes the importance of optimizing traveler throughput while managing security risks associated with identity verification through biometric modalities. The study evaluates the performance of various biometric algorithms, exploring factors such as false non-match rates, cost implications of security errors, and the trade-offs between inspection speed and thoroughness. The findings aim to enhance operational efficiency while ensuring robust security measures at border access points.

E N D
Balancing Throughput and Security Risk in a Border Management System Bojan Cukic Lane Department of CSEE West Virginia University Dagstuhl Seminar 10431
UML Model with performance annotations Performance Model Risk Model Application’s Performance/risk feedback Framework
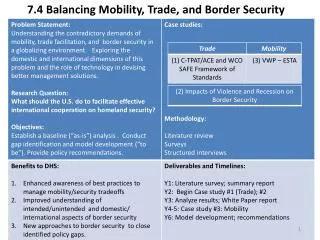
Traveler Queues Inspection Stations (w/ biometric ) Public Key Directory Secondary Inspection / Detainment Watch Lists / Identity DB Border Access Legend =Required Signal =Optional Signal = Movement =Optional Movement Risk in Border Management Modality, vulnerability, exceptions, throughput? Acceptance,modality, quality? Local, distributed, or central? Modality, quality, scalability, update, access ? False Non - Match Rate, Inconvenience acceptance? Risk function False Match Rate
Risk Model Parameters • Which biometric modality /algorithm meets security requirements? • Impostor arrival rate varies • One in thousand passengers (10-3) • One in hundred thousand passengers (10-5) • One in ten million passengers (10-7) • Misclassification cost ratioμ=C(+|-):C(-|+) • It is 100 times more costly to miss an impostor (10-2) • 10,000 times more costly to miss an impostor (10-4) • 1,000,000 times more costly to miss an impostor (10-6) • 100,000,000 times more costly to miss an impostor (10-8)
Modeling Approach • System architecture is nontrivial • Static and dynamic architectural aspects using UML. • Quantitative performance models using LQN. • Risk analysis • Border security systems rely on identity verification. • Validity of traveler’s biometric information. • Checks through watch lists. • Cost Curve modeling.
Face Recognition Classification 2006 Face Recognition Vendor Test (FRVT)
P(+)=0.01 P(-)=0.99 P(+)=0.0001 P(-)=0.9999 1E-4 P(+)=0.001 P(-)=0.999 Face recognition cost curves 1E-1 1E-2 1E-3
Feasibility Analysis: In feasible implementations, FMR is NOT ACCEPTABLE!
Performance considerations • Top performance drivers • A: Fingerprint capture • B: Face capture • C:Inspection Data • D:Review Documents • E:ReviewDocuments Secondary Inspection A:20 sec B:8 sec C: 3 sec D: 13 sec E:450sec A:10 sec B:3 sec C: 2 sec D: 16 sec E:450sec Total waiting time:15.4 min Performance options under the same riskfactors, one arrival rate… Low Cost, Low Benefit High Cost, Low Benefit A:11 sec B:3 sec C: 2 sec D: 10 sec E:430sec Low Cost, High Benefit High Cost, High Benefit
Summary • Framework to integrate an analytical performance model with a security risk model. . • Minimize the risk of identity management errors, while maintaining acceptable passenger throughput. • Currently • Developing and evaluating adaptation control options. • Evaluating the impact of biometric fusion algorithms. • Challenges • Contexts: • Unseen arrival distributions (A380!). • Requirements: • Proactive risk management (country of origin - based) • Can workload impact security risk? • Justification and explanation of operational configurations. • Are human operators subject to adaptation suggestions?