Download
1 / 124
1.24k likes | 1.38k Views
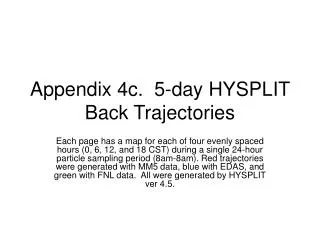
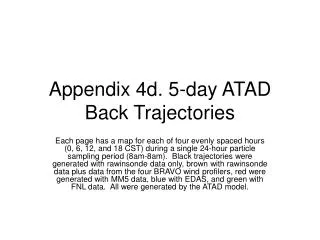
This document presents 5-day air back trajectories generated by the ATAD model during a 24-hour particle sampling period (8 AM to 8 AM CST). Each page features maps illustrating trajectories at four evenly spaced hours (0, 6, 12, and 18 CST). The trajectories are color-coded: black for rawinsonde data only, brown for rawinsonde plus BRAVO wind profiler data, red for MM5 data, blue for EDAS data, and green for FNL data. These visualizations help in understanding air movement and pollutant dispersion over the specified period.

E N D
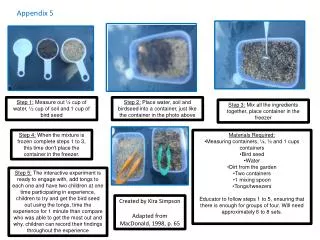
Appendix 4d. 5-day ATAD Back Trajectories Each page has a map for each of four evenly spaced hours (0, 6, 12, and 18 CST) during a single 24-hour particle sampling period (8am-8am). Black trajectories were generated with rawinsonde data only, brown with rawinsonde data plus data from the four BRAVO wind profilers, red were generated with MM5 data, blue with EDAS, and green with FNL data. All were generated by the ATAD model.