Download
1 / 25
250 likes | 408 Views
System Monitoring at the DAEC. SysMon. SMART. Teaming up to get the most out of System Monitoring!. SysMon. Result of 2 EPRI Task Group efforts published in March 1997 and March 1998. Past tendency was to trend a parameter because it can be trended.

E N D
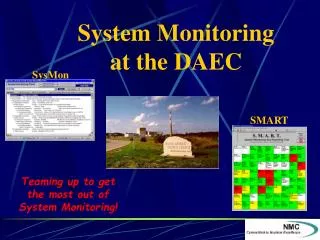
System Monitoring at the DAEC SysMon SMART Teaming up to get the most out of System Monitoring!
SysMon • Result of 2 EPRI Task Group efforts published in March 1997 and March 1998. • Past tendency was to trend a parameter because it can be trended. • EPRI methodology provides a consistent, proactive approach based on the ability to predict degradation and preclude failure of specific system functions.
Basic Methodology • Focuses on selecting important parameters for monitoring based on primary system functions and degradation mechanisms that can defeat primary functions. • Stresses system level monitoring by the integrated use of tools, technologies, and data obtained from many sources.
Elements of Effective Programs • Program Scope Definition • Define System Performance Goals and Indicators • Define Importance of System Functions • Define Degradation Mechanisms and Indicators • Identify Data Requirements • Identify Actions Required • Establish Communication Methods • System Monitoring Documentation • Perform System Monitoring
Types of Monitoring • Indirect - The periodic review of historical, programmatic system information for the purpose of predicting future system performance. • Direct - A periodic review of physical parameters to assess current system performance and to identify system degradation.
Layers in Direct Monitoring • Data Collection Frequency • Monitoring Frequency • Trending Method • Acceptance Bands • Action Required • Function • Failure Modes • Failure Effects • Degradation Mechanisms • Degradation Indicators • Data Source
Typical SysMon Layout SMART retrieves the actual data and provides it to the System Engineer.
S.M.A.R.T. An important part of your system monitoring toolbox.
The History of SMART • March 1997 - EPRI issues “Guideline for System Monitoring by System Engineers” • June 1997 - AR written to review effectiveness and use of the System Health and Status reports on the LAN. • March 1998 - EPRI issues 37 System Monitoring Plans and software.
The History of SMART • June 1998 - Project Team convenes to develop an effective system monitoring program. • June 1998 - All system engineers trained on EPRI methodology and SysMon software. • October 1998 - First system plan declared ready and implemented into SMART.
Requirements for SMART • Data is easily gathered with little or none performed by the System Engineer • Use is made of expertise outside of Systems Engineering • Computer programs are reliable • Current and historical analyses of trends are included
Requirements for SMART • The system can be monitored remotely • The System Engineer and other users are alerted to problem areas • The System Engineer is properly trained on the program • Output from the program is well communicated and reported
Requirements for SMART • Use of the program is uniform across all systems • The basis for trending specific parameters is documented • The program is easy to use
Purposes of SMART • Automatically collect and make readily accessible to the System Engineer data which is important to trend (as determined by the EPRI methodology). • Provide the medium for the System Engineer to share subsequent analyses with plant personnel.
SMART and SysMon • SMART taps into the SysMon database to extract stored information regarding monitoring bases.
Structure of SMART • Main Features Include: • Main Annunciator Window • Health & Status (Information) • Direct Monitoring Annunciator Window • Direct Monitoring Detail Screen • Auto (Indirect) Monitoring Screen • Parameter Maintenance
Sources of Data • Plant Information (PI) • In-plant Transmitters • Operator Rounds via Handheld Dataloggers • Equipment Monitoring Database • Vibration Analysis • Oil Analysis • Thermography • Inservice Testing (IST) • Instrument Trending Program • Surveillance Test Procedures • Manual Input
System Health Assessment Rating GuidelineSystem Health Assessments use a four level rating scheme to evaluate overall health of the system. “Key Parameters” are used to assess the overall health of the system.Consider safety significance of issues involved when selecting a Key Parameter rating. If any Key Parameter is Marginal (Yellow), the overall rating should be Marginal (Yellow) or Needs Improvement (Red). If any Key Parameter is Needs Improvement (Red), the overall rating should be Needs Improvement (Red).