Download
1 / 61
620 likes | 770 Views
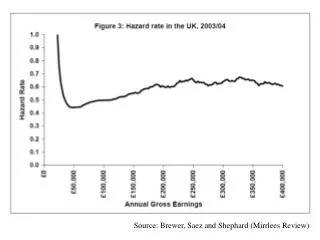
Source: Brewer, Saez and Shephard (Mirrlees Review). Pareto distribution as an approximation to the income distribution. Source: Brewer, Saez and Shephard (Mirrlees Review). Source: Brewer, Saez and Shephard (Mirrlees Review). Table: Taxable Income Elasticities at the Top.

E N D
Pareto distribution as an approximation to the income distribution
Table: Taxable Income Elasticities at the Top Simple Difference (top 1%) DD using top 5-1% as control 1978 vs 1981 0.32 0.08 1986 vs 1989 0.38 0.41 1978 vs 1962 0.63 0.86 2003 vs 1978 0.89 0.64 Full time series 0.69 0.46 (0.12) (0.13) With updated data the estimate remains in the .35 - .55 range with a central estimate of .46, but remain quite fragile Note also the key relationship between the size of elasticity and the tax base (Slemrod and Kopczuk, 2002)
EITC Schedule in US – Single Parent Families, 2004 • Larger credit, covering higher earners for families with two or more children. 6
Number of EITC Recipient Families (Millions) Source: Green Book, 2004, Joint Committee on Taxation, Ways and Means Committee 9
In-work Credits in OECD Countries in 2001 Central position in the OECD labour market policy debate 10
The EITC and marginal tax rates more broadly Marginal Tax Rates for Families with One Child, 2004 Source: NBER's TAXSIM model tabulation by Hoynes (2006) 11
The Tax Credit Expansion in the UK: 2000 Reform transfers per week for a min. wage lone parent £120 - 55% 70% 12
The US Earned Income Tax Credit EITC 14
The UK and US tax credit systems compared WFTC EITC 16
Canadian Self Sufficiency Program Budget Constraint for a Single Parent on Minimum Wage SSP IA 17
Monthly Employment Rate for a Single Parent with One Child BC Canadian Self Sufficiency Program 18
Estimating the impact of a tax credit – with no experiment.In 1984 the US EITC system looked like: Maximum credit $550 Phase-out at 12.2% Phase-in at 11% 19
The EITC in 1996 Maximum credit now $3556 Phase-in increased to 40% Phase-out at 21% 22
Evaluating the UK Tax Credit Reforms transfers per week for a min. wage lone parent pre and post 2000 £120 - 55% 70% 23
Difference-in-Differences: Lone Mothers Employment Data: Spring 1996 – Spring 2003. Drop: Summer 1999 – Spring 2000 inclusive; individuals aged over 45. Outcome: employment. Average impact x 100, employment percentage. Matching Covariates: age, education, region, ethnicity,.. 26
WFTC interactions with other taxes and benefits in the UK 27 single parent on minimum wage
WFTC interactions with other taxes and benefits in the UK 28
WFTC interactions with other taxes and benefits in the UK 29
Weekly Hours Worked Low Education Single Mothers (aged 18-45) Lower hours limit 32
Weekly Hours Worked Low Education Single Childless Women (aged 18-45) 33
Reform impacts on budget constraints for lone parent change in in-work support only Assumes 2 children < 11, hourly wage of £5/hour, no childcare costs, no rent, no child support 34
Reform impacts on budget constraints for lone parent Adding in the change in income support Assumes 2 children < 11, hourly wage of £5/hour, no childcare costs, no rent, no child support 35
Take-up and WFTC Variation in take-up probability with entitlement to FC/WFTC 36
Structural Model Elasticities (a) Youngest Child Aged 11-18 38
Structural Model Elasticities (c) Youngest Child Aged 0-4 • Check the robustness of the structural model by the ability to simulate the impact of the WFTC reform 39
Structural Evaluation Simulation Results: WFTC Expansion Notes: Simulated on FRS data; Standard errors in italics. All: 5.12 without change in take-up – key impact effect 40
Structural Evaluation Simulation Results: All Reforms Notes: Simulated on FRS data; Standard errors in italics. 41
Difference-in-Differences: Impact on Employment Data: Spring 1996 – Spring 2003. Drop: Summer 1999 – Spring 2000 inclusive; individuals aged over 45. Outcome: employment. Average impact x 100, employment percentage. Matching Covariates: age, education, region, ethnicity,..
Evaluation of the ‘ex-ante’ structural model • The diff-in-diff parameter can be identified from the structural evaluation model • Simulated diff-in-diff parameter • The structural model then defines the average impact of the policy on the treated as: • Compare simulated diff-in-diff moment with diff-in-diff
All reforms, 1999-2002 WFTC impact 44
An Optimal Schedule After Tax Income EITC ‘bubble’ region 0 0 Earnings 46
A ‘Typical’ ‘Integrated’ Optimal Schedule After Tax Income ‘phase-out’ region subsidy or ‘phase-in’ region break even point Some ‘Income Support’ – but what form? 0 0 Earnings 47
The Optimal Schedule, Youngest Child Aged 0-4 Weekly earnings March 2002 prices £6 per hour 48 Blundell and Shephard (2006)
An Optimal Schedule, Youngest Child Aged 5-10 Weekly earnings March 2002 prices 49 Blundell and Shephard (2006)
An Optimal Schedule, Youngest Child Aged 11-18 Weekly earnings March 2002 prices 50 Blundell and Shephard (2006)


![[f´‚nE˘RIks]](https://cdn0.slideserve.com/636013/f-ne-riks-dt.jpg)