Download
1 / 19
240 likes | 603 Views
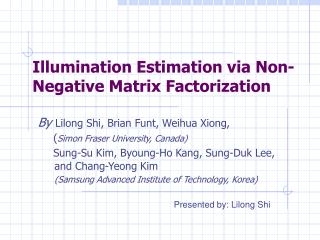
Illumination Estimation via Thin Plate Spline. Weihua Xiong ( OmniVision Technology,USA ) Lilong Shi, Brian Funt ( Simon Fraser University, Canada) Sung-Su Kim, Byoung-Ho Kang, Sung-Duk Lee, and Chang-Yeong Kim ( Samsung Advanced Institute of Technology, Korea ).

E N D
Illumination Estimation via Thin Plate Spline Weihua Xiong (OmniVision Technology,USA) Lilong Shi, Brian Funt (Simon Fraser University, Canada) Sung-Su Kim, Byoung-Ho Kang, Sung-Duk Lee, and Chang-Yeong Kim (Samsung Advanced Institute of Technology, Korea)
Automatic White Balancing Estimate the Illumination Image Original Surface Color
Illumination Estimation Methods Non-statistical Solution Gray World (1980 Buchsbaum) Max-RGB Shades of Gray (2004 Finlayson) Gray-Edge Hypothesis (Weijei & Gevers 2005) Statistics Based Solution Color by Correlation (Finlayson at. el. 2001) Neural Network (Funt. 2002) Support Vector Regression (Xiong, 2004) KL-Divergence (Rosenberg 2001)
Limitations of previous statistical solutions • Color by Correlation Illuminations pre-fixed • Neural Network Local Minima Many parameters to be determined by user • Support Vector Regression
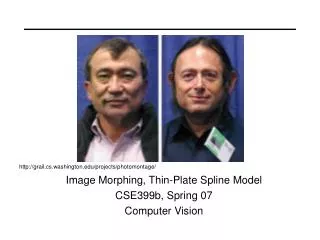
Thin Plate Spline (TPS) Interpolation Thin Plate Spline (TPS) interpolates between control points Minimizes the bending energy function of a thin metal plate. Originally designed for deformable matching between images Advantage Output is always unique Fits to all the training data smoothly No extrapolation Solution can never be singular Has been extended into 3D for mapping from RGB to XYZ (CIC 2005) Source Image Target Image
Thumbnail Input The method uses thumbnails as input 8-by-8 input RGB images Each of the 64 pixels is the average of pixels from original input image Original Image Thumbnail Image Change into chromaticity space [R/(R+G+B) G/(R+G+B)] So we extend TPS to 128 Dimensions here
TPS for AWB: Intuition Basic idea Similar images require similar white balancing Illumination rg-chromaticity interpolated Training set contains images and their respective white points (illumination color) For input image Interpolate white point based on the distance between the input and training images
TPS Details • Training set consists of • N images • Corresponding illumination chromaticity values • (for case of 8x8x2=128 input image) • {(Ii,1,Ii,2,…Ii,128), (ri,gi)}. (i/o pair) • TPS determines parameters • wi and (a0, a1, a2, …, a128) • Controls two non-rigid mapping functions fr, fg, • such that (ri,gi) = (fr(Ii,1,Ii,2,…Ii,128), fg(Ii,1,Ii,2,…Ii,128)). • TPS is defined by a non-linear function with an additional linear term. • Without loss of generality, consider only frdefinition in which wi and ai are coefficients to be determined:
TPS Details (Continued) Nonlinear Term Linear Term Weighted distance to every image in the training set X is either r or g chromaticity
TPS Details (Continued) Smoothness constraint where is the total bending energy described in terms of the curvature of the energy is minimized when
Direct Solution (once per training set) Define L: Uij = U(||(Ii1,Ii2,…Ii128)- (Ij1,Ij2,…Ij128)||, U(r) = r2*logr 0 is ZERO matrix with size of 129x129 Additionally define W= (w1, w2,…, wN, a0, a1, a2, …, a128)T, and K = (r1, r2, r3… rN,0,0,0,….0)T. N + 129 unknowns and N + 129 equations We have K =LW and solution W = L-1K
Graphical Example of TPS Interpolation Error Nonlinear Term Original Training Data Pairs Linear Term
TPS Result TPS Output Ground Truth Image Input Image (Bluish)
TPS on Large Image Database Average of bright part on the grayball is assumed to the true illumination value
Performance Comparison • The database is divided into two non-overlapped subsets • Test set size 4080. Training data set size 3581
Algorithm Comparison Using Wilcoxon TPS is equal to SVR, but better than GW, SoG, and Max
Conclusion Thin Plate Interpolation is applied in illumination estimation Performs non-uniform interpolation Assumption that similar images require similar color correction Method is parameter independent Both training and testing are fast The performance on natural images shows the accuracy of TPS illumination estimation to be good