Download
1 / 45
480 likes | 923 Views
Eutrophication 3 Consequences of Eutrophication. Alice Newton. Consequences of Eutrophication. Main Impacts of Eutrophication, EEA. · Ecological reductions in biodiversity; Changes in the structure and functioning of the marine ecosystems; Socio-Economic

E N D
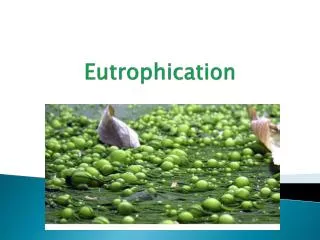
Eutrophication 3Consequences of Eutrophication Alice Newton
Main Impacts of Eutrophication, EEA • · Ecological • reductions in biodiversity; • Changes in the structure and functioning of the marine ecosystems; • Socio-Economic • · reductions in the natural resources of dermersal fish and shellfish; • · reduced income from maricultures of fish and shellfish; • · reduced recreational value and income from tourism; • · increased risk of poisoning of animals including humans by algal toxins.
Consequences of Eutrophication heed.unh.edu/report.html • Ecological • Hypoxia and Anoxia • Increased sulphides and H2S • Increased phyto biomass & HAB • Increased turbidity • Decreased biodiversity • Loss of seagrass and kelp beds • Coral reef destruction • Marine mammal & seabird deaths • Socio-Economic • Decreased fisheries and aquaculture yields • Fish kills • Shellfish poisoning • Contamination of aquifers, taste, odour, NO3& NO2 • Loss of tourism revenues
Direct Chlorophyll Primary Production Macroalgal biomass Sedimentation of OC Si:N N:P HAB Phytoplankton community Indirect Benthic community Pelagic community Vascular plants Habitat diversity Transparency OC in sediments Sediment biogeochemistry Bottom water Oxygen Seasonal cycles Mortalities Biodiversity Direct and Indirect Responses Cloern, J.E. 2001. Review. Our evolving conceptual model of the coastaleutrophication problem. Mar. Ecol. Prog. Ser. 210: 223-253.)
Hypoxia & Anoxiahttp://state-of-coast.noaa.gov/bulletins/html/hyp_09/hyp.html • Night-time oxygen sag due to excessive respiration of algal bloom • Bloom “die off” and decomposition raises BOD • Hypoxia (<2ppm) or anoxia may result • Less mobile animals most affected • Changes in community structure to short lived spp eg polycheate worms • Changing interactions of predator-prey eg vertical migration of zooplankton perturbed
Hypoxia & Anoxiahttp://www.mst.dk/homepage/default.asp?Sub=http://www.mst.dk/udgiv/Publications/2001/87-7944-507-1/html/kap04_eng.htm Deadfish float!
How does the bottom layer become hypoxic? 1 2 3 4 5 6 (Time magazine)
Sulphides and H2S • Plant material (decomposing blooms) settles to seabed • Decomposition results in elevated concentrations of sulphides • Affects benthos eg seagrasses • Anaerobes
Phytoplankton community • Nutrients boost phytoplankton production leading to blooms • Water becomes turbid and oxygen depleted • Eutrophication alters Si:N • Diatoms require Si but flagellates do noteg off German coast N&P have increased 4x relative to Si, diatoms have decreased and flagellates have increased 10x. • Shift in phytoplankton community may favor toxic algae leading to HAB
“Red” Tides...HABwww.redtide.whoi.edu/hab/ Noctiluca in California Not Always Red…
HAB www.fmri.usf.edu/ecohab/gallery.HTM • Natural phenomenon, increased frequency linked to eutrophication. • “Red” tides, may in fact be brown or green. Some are toxic in low concentrations and do not discolor the water • Non-toxic blooms can be lethal because of anoxia or hypoxia • Toxic tides may be toxic to vertebrates such as fish and cause fish kills • Toxic tides may NOT be toxic to shellfish that accumulate them causing shellfish poisoning of humans
Some HAB Species Pfisteria Pseudo-nizschia Alexandrium Dinophysis & Ceratium
Alexandrium monilatumWater discoloration in Tampa bay, summer 2000. Chattonella subsalsaChloromonad. Produces brevetoxins Cryptoperidiniopsoid Dinoflagellates linked to fish kills. Dinophysis groupe.g.D. caudata, D. acuminata, D. acuta, D. fortii, Phalacroma rotundatum. Produce okadaic acid, Diarrheic Shellfish Poisoning. Gambierdiscus toxicusis Florida's second most problematic HAB species. Gymnodinium catenatum has not been found in the Gulf of Mexico. Gymnodinium pulchellum has been associated with fish kills. Gyrodinium galatheanum often confused with other small dinoflagellates. Karenia brevisis the most common cause of red tides on Florida's west coast. Karenia mikimotoifound in Florida and Texas marine waters & often confused with Karenia brevis, Florida's red tide organism. Pfiesteria piscicidahas caused numerous problems in N. Carolina and Maryland. Pfiesteria specieshave been found in Florida waters. Benthic Prorocentrum Group Examples include P. belizeanum, P. hoffmannianum, P. lima, P. mexicanum
Pfisteria Ciguatera NSP DSP ASP Cyanobacteria Fish kills, human neuroeffects Neurotoxic Diarrehetic Amnesic Freshwaters: fish & livestock mortalities, foul smell & taste, human health hazard Types of HAB
Nutrients & Nuisance Blooms (modified from Rosenberg et al. 1990, as printed in NRC 2000). The chart shows inputs of nitrogen and phosphorus to Laholm Bay on the coast of Sweden from 1950 to 1988. Note that P inputs decreased after 1970 due to control efforts, while inputs of N increased. Eutrophication first becameapparent in the bay in 1970 and became much worse in the subsequent two decades, clearly indicating that N caused theeutrophication
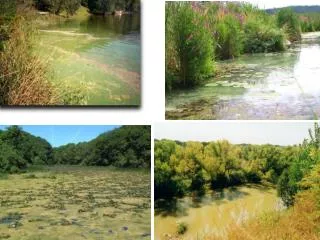
Ulva eg Venice Lagoon, Cork Harbour,Belfast Lough, Moreton bay http://www.healthywaterways.env.qld.gov.au/Topics/HealthReportCard/ReportCardResults.cfm?ReportCardID=4 http://www.boprc.govt.nz/www/Responsibilities/WaterManagement/Ecology/SeaLettuce.htm Macroalgal Nuisance Blooms
Macroalgal Nuisance Blooms • Enteromorpha and filamentous algal matseg Ria Formosa http://f-ects.ifm.uni-hamburg.de/fieldwork/formosa.html
Decreased fisheries yields • Moderate nutrient enrichment may occasionally lead to increased populations of fish but diversity may decline. • Severe nutrient enrichment leads to loss of commercially valuable fishes. • Changes in the phytoplankton community changes the food webeg small flagellates grazed by jellyfish rather than finfish e.g. Black Sea.
Fish Kills • Usually Hypoxia is the reason: although fish are mobile, sometimes they are trapped by low oxygen water • Toxic algae: some of these are toxic to vertebrates inc. fish
Decreased aquaculture yields • Large scale: China • 1970’s “blue” revolution, increased aquaculture(snapper & grouper) • 20-30 HAB p.a. • Summer 2000, 2700 sq mile HAB, South of Shangai $ 240 damage • Local scale: Ria Formosa
Other impacts related to HAB • Shellfish poisoning • Marine mammal mortalities • Marine bird mortalities • Decreased biodiversity
Loss of tourism revenues • Phaeocystis blooms form noxious smelling tide (can look like raw sewage) • 1990’s HAB in N. Adriatic, resulted in beach closures and loss of summer season tourism
Seagrasses and kelp beds • Very sensitive to effects of eutrophication. • Seagrasses and kelp often light limited • Turbidity: submerged seagrasses and kelp harmed by reduced water clarity • Epiphytic algae also cause shading • Elevated concentrations of sulphides, due to decomposing bloom organisms, can be toxic to seagrasses www.dnr.state.md.us/bay/sav/index.html
The bottom-dwelling plants of a marine ecosystemthat received natural rates of nitrogen addition. Note the highdiversity of these plants and their spacing. The bottom-dwelling plants of a marine ecosystem thatreceived high rates of nitrogen input. Note that there are fewplant species, and that the leaves of these are covered with athick layer of epiphytic algae.
Seagrass beds of Black Sea • North west of Black Sea had large seagrass beds • Vicinity of Danube Delta (Romania) • Increased turbidity of water and nutrient enrichment • Sea grass beds disappearing
3000 2500 2000 1500 1000 500 0 Fertilizer consumption in countries around the Black Sea (100 grams per hectare of arable land) 1961-1999 after L.Mee Collapse of centrally planned economy The Green Revolution Bulgaria Georgia Romania Russia Turkey Ukraine
At least 50% of the nutrients reaching the Black Sea come from agriculture The green revolution End of centrally planned economy after L.Mee
Area occupied by Phyllophora, 1950s after L.Mee
Area occupied by Phyllophora, 1970s after L.Mee
Area occupied by Phyllophora, 1980s after L.Mee
Coral destruction • Very sensitive to effects of eutrophication • Turbidity: coral reefs harmed by reduced water clarity coral.aoml.noaa.gov www.wri.org/indictrs/reefrisk.htm www.aims.gov.au/pages/research/coral-bleaching/scr1998/scr-00.html
Coral destruction • Epiphytic algae overgrow coral coral.aoml.noaa.gov www.wri.org/indictrs/reefrisk.htm www.aims.gov.au/pages/research/coral-bleaching/scr1998/scr-00.html
New Scientist article • January 2004 • Link between agriculture in E. Australia and coral deaths on Barrier Reef
Aquifer contaminationwww.ianr.unledu/PUBS/water/ g1369.htm#meth • Acidification of lakes and streams by acid rain causes loss of freshwater fish • Aquifer contamination by NO3 & NO2 Methemoglobinemia (Blue baby Syndrome) • eg Faro where upper limit reached 1995. Aquifers condemned for human consumption.
The Drinking Water Directive guideline value and the maximum allowable concentration for nitrate in drinking water are exceeded in many EU groundwater supplies. Percentage of groundwater bodies where the guide value and the MAC are exceeded: very frequently (>50 % of sites); frequently (>25 %); rarely (0–25 %); and not at all. Aquifer NO3 contamination in the EU. EEA