Download
1 / 39
410 likes | 712 Views
The origin of genetic variation. Motivation Evolution is a change in the genotype of the population over time. Phenotypic differences between species reflects genetic differences between species = genetic variation across species What is the origin of genetic variation?? Ultimate Source:

E N D
The origin of genetic variation • Motivation Evolution is a change in the genotype of the population over time. Phenotypic differences between species reflects genetic differences between species = genetic variation across species What is the origin of genetic variation?? Ultimate Source: MUTATION!!!!!!!!!!!!!!!!!!!!!!!!!!!!
So what are you looking at? Who has a mutation they would like to discuss?
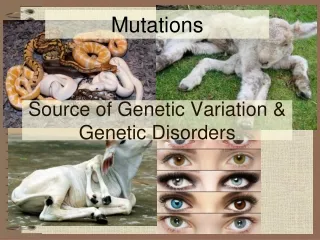
II. What is a mutation??? -offspring has DNA that is different from both parents -deleterious alleles in population are often referred to as mutations Mutation = change in nucleotide, deletion, insertion, duplication, inversion….
mRNA Note: Genetic Redundancy of Code Results in Synonymous & NonSynonymous Mutations for Protein Coding Regions
Transitions are more common than transversions because DNA repair enzymes can recognize wrong insertion representing a a transition better than a transversion
What are the effects of new (deletion) mutations? Deleterious? Strong? s = 1 – fitness(mutation)/fitness(without mutation) Fitness of genotype with mutation = 1 - s
. . . . . . RATES: How do you measure mutation rates at the DNA LEVEL? Direct sequencing of C. elegans Mutation Accumulation Lines Denver et al. 2004 Generation 280: 29,561 bp in 72 MA lines Generation 353: 14,550 bp in 68 MA lines Generation 396: 18,718 bp in 58 MA lines Detected: 30 mutations (17/30 indels) Transitions >> Transversions 1.6:1 Mutation rate: 2.1 x 10⁻⁸ /site/generation 400 generations = about 1 mutation/gamete or 2/zygote
Mutation accumulation lines Homozygous progenitor Single seed descent Mutation accumulation lines Any genetic differences between lines = mutations
Field Site After Planting 100 lines(25th generation of MA) x 70 Replicates/line = 7000 + 500 parentals (founders) = 7500 plants
MA lines have diverged in fitness Founder performance is near the average MA performance Block<0.0001 MA line 0.029 MA line vs. Founder 0.8650 Subline 0.0051
Do Mutation Rates for Performance Differ Between Laboratory and Nature?? Mutation rates for fitness very high in field Suggest that many mutations do effect fitness, though of small effect Rutter et al., 2010
The Rate and Molecular Spectrum of Spontaneous Mutations in Arabidopsis thaliana, Ossowski et al., 2010, Science, 1 January • Conducted 30 generations of MA • Screened 5 MA lines (we tested for performance) • Detected 114 mutations • Mutation Rate: • 30 x 5 = 150 episodes • 111 mutations/150 • ~ 1.4 mutations per diploid or zygote generation • Each line ~ 20 mutations • Accuracy: about 1 new mutation for every 200 mbp replicated
Mutations Detected Dark blue lines are mutations in coding regions
Comparison of Mutation Rate at Sequence Level vs. Performance • For each new zygote: • 1.4 mutations at the sequence level • 0.24 mutation rate for performance • About 20% of mutations effect performance • About 80% of mutations have no effect on performance • About 20% of all sequence mutations were nonsynonymous • and in coding regions • Rutter et al., Evolution, 2012
Adaptive landscapes & mutation parameters New MA lines from Sweden and France Fisher, 1930 Beginning of a conceptual framework for the prediction of mutation effects (with Jon Agren, Thomas Lenormand & Eric Imbert)
Timing of expression differs among members of the globin gene families
Homologous genes come in one of two types: O P Paralogs- loci that diverge following duplication Orthologs- loci that are homologous then diverge following speciation Pseudogenes- class of genes that have no function (non-transcribed)
V. Chromosome Inversions Suppress recombination
inversions can keep gene combinations intact, eg. AbCdeF AND THE EVOLUTIONARY IMPORTANCE?????????
Evidence that inversions are associated with adaptation in Drosophila subobscura ALSO LINKAGE DISEQUILIBRIUM WITHIN INVERSION
Mimulus guttatus Figure 1. Geographic distribution of the chromosomal inversion. (A) Map of western North America with the locations of populations ofcoastal perennials (blue), inland annuals (orange), and inland perennials (purple), as well as obligate self-fertilizing species M. nasutus (yellow). (B) Marker order of the AN and PE inversion arrangements along linkage group eight. Inland annuals and M. nasutus had the AN arrangement whilecoastal and inland perennials all had the PE arrangement. doi:10.1371/journal.pbio.1000500.g001 Adaptive Inversion Contributes to Isolation PLoS Biology | www.plosbiology.org 3 September 2010 | Volume 8 | Issue 9 | e1000500
Figure 2. Replicated effect of the inversion locus. (A) F2 progeny with parental ecotypic phenotypes, from a cross between the SWB (coastal perennial) and LMC (inland annual) populations. (B–E) Effect of the inversion on flowering time in four independently derived F2 mapping populations created through crosses between independent inland annual and coastal perennial populations. (F) Effects of the inversion on flowering time in cross between inland annual and inland perennial populations. The mean flowering times (61 SE) of F2s that were homozygous for the AN arrangement (AA), heterozygous (AB), and homozygous for the PE arrangement (BB) at Micro6046 are indicated. The percentage of F2 variance/ parental divergence explained by the inversion is presented above each bar graph. Note: y-axes do not originate at zero. doi:10.1371/journal.pbio.1000500.g002
VI. Polyploidy duplication of the basic number of chromosomes, e.g.: 2n to 3 n to 4n etc., Results in instant speciation Common, in plants Why? Answ: meiosis exposed, sex chromo. rare, selfing frequent.
VII. Much variation in populations • Heterozygosity: average frequency of heterozygotes across loci • Proportion of loci polymorphic
The distribution of enzyme heterozygosities among species of animals and plants Vertebrates Fraction of loci that are heterozygous in the genotype of the average individual
Sequencing studies have revealed enormous genetic diversity at the cystic fibrosis locus in humans. Loss of function mutations found in humans with cystic fibrosis
Determining CCR5 genotypes by electrophoresis of DNA Calculating Heterozygosity: Origin of fragment size: shorter by 32 nuc.
16/43= 0.37 (Hets) F(D32)= 16 + 2x1 = 18 18/86= 0.21
Conclusion • Mutation rates are high • Mutations effect fitness • Mutations contribute to genetic variation • Duplications can lead to new gene function • Inversions can protect adaptations • Polyploidy can result in instant speciation • Mutations are important to evolution