
Uploaded by
uriel
1 SLIDES
136 VIEWS
10LIKES
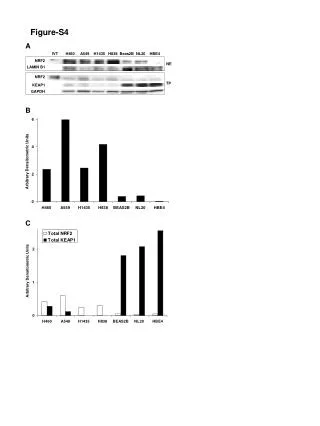
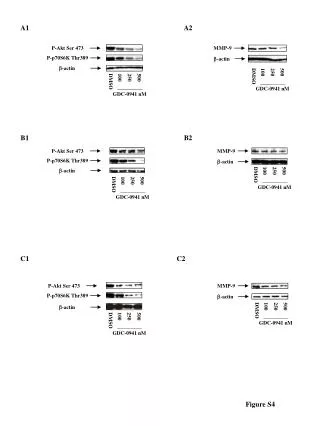
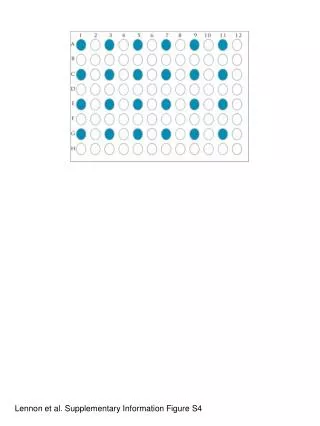
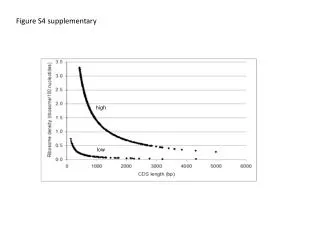
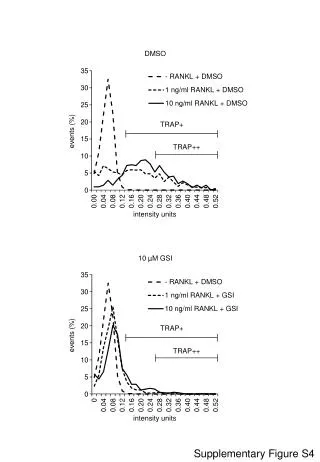
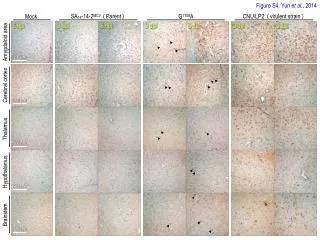
Comprehensive Analysis of Figure-S4: Visual Data Interpretation and Insights
DESCRIPTION
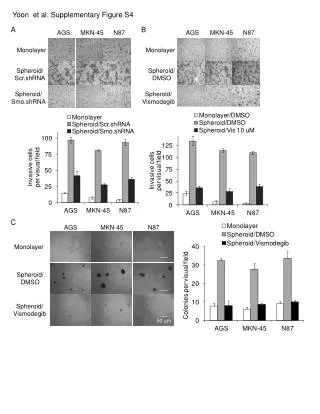
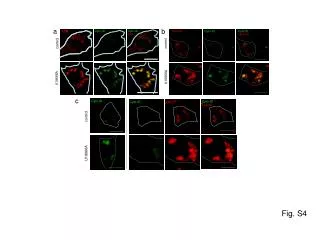
Figure-S4 illustrates critical data trends and comparisons through panels A, B, and C. Each section of the figure showcases unique aspects of the data, providing valuable insights into the underlying patterns. Panel A presents an overview, while Panel B delves into specific variables and relationships, and Panel C highlights significant findings relevant to the study. This analysis aids in better understanding the complex interactions presented in the data, facilitating informed interpretations and conclusions.
Download
1 / 1
Download Presentation 
Comprehensive Analysis of Figure-S4: Visual Data Interpretation and Insights
An Image/Link below is provided (as is) to download presentation
Download Policy: Content on the Website is provided to you AS IS for your information and personal use and may not be sold / licensed / shared on other websites without getting consent from its author.
Content is provided to you AS IS for your information and personal use only.
Download presentation by click this link.
While downloading, if for some reason you are not able to download a presentation, the publisher may have deleted the file from their server.
During download, if you can't get a presentation, the file might be deleted by the publisher.
E N D


More Related