Acceleration
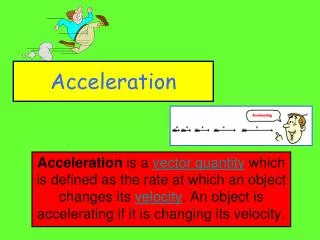
Acceleration. Calculating acceleration and interpreting velocity/time graphs. Acceleration. As we have discussed so far, speed describes the distance something travels in a certain amount of time. But speed can change.

Acceleration
E N D
Presentation Transcript
Acceleration Calculating acceleration and interpreting velocity/time graphs
Acceleration • As we have discussed so far, speed describes the distance something travels in a certain amount of time. • But speed can change. • The rate at which the velocity of an object changes is called acceleration. • Acceleration doesn’t always mean than an object increases in speed. It can also mean a decrease in speed and/or a change in direction.
Direction change - acceleration • Since acceleration deals with velocity, a direction change will cause a change in acceleration. • So, even if you don’t speed up or slow down, you can still accelerate by turning as velocity is changed.
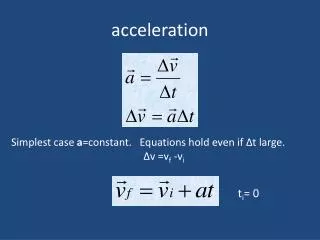
Calculating acceleration • Any type of straight line motion can be calculated using the following formula • a = vf - vi t or • acceleration = (final velocity – initial velocity) / time
Units for acceleration • Since acceleration is the change in velocity (m/s) divided by time (s), the SI unit for acceleration is m/s2or m/s/s. The seconds squared shows that velocity changes per second. • Acceleration, like velocity can also be written in other units too. You can measure your acceleration on a car’s speedometer in miles/hour/second for example.
Positive and negative acceleration • A positive value for acceleration shows an object is speeding up. Ex: a car goes from 0 mph to 60 mph in 6 seconds. a? a = vf-vi60-0 mph t 6 sec = 10 mph/sec • A negative value for acceleration shows an object is slowing down. Ex: a satellite slows from 190 m/s to 120 m/s as it over changes its orbit over a 240 seconds. a? a = vf-vi120 – 190 m/s t 240 sec = - 0.29 m/s2
Velocity-time graphs • Velocity-time graphs show acceleration unlike the distance-time graphs which show only speed.