Download

1 / 39
540 likes | 1.26k Views
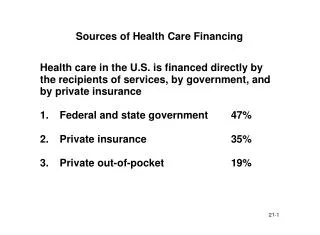
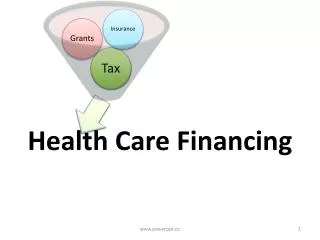
Sources of Health Care Financing. The Elements of Health System. Management. Service Provision. Resource Inputs (trained staff,drugs, knowledge, facilities,etc.). Organization (ministry, hospitals, etc.). Financial support. Civil service and public sector reform

E N D
The Elements of Health System Management Service Provision Resource Inputs (trained staff,drugs, knowledge, facilities,etc.) Organization (ministry, hospitals, etc.) Financial support
Civil service and public sector reform Development in financing the social sector Managed-market health care reforms Development in epidemiology and health economics Health Sector Reform:
HSR occurs as part of changes in public sector reforms. Changes in health financing: the need to assess the advantages and disadvantages of user fees, community financing, voucher systems and different forms of insurance Traditional bureaucratic structures do not necessarily sufficient incentives to guarantee cost-effective or user-friendly services, neither are unregulated private markets capable of achieving the mix of objectives that health systems seek to satisfy. Health Sector Reform -2-
0.3 45000 population 65+ (%) Japan population 65+ (%) Korea 40000 population 65+ (%) Thailand 0.25 population 65+ (%) Sri Lanka 35000 GNP per capita, Japan GNP per capita, Korea GNP per capita, Thailand 0.2 30000 GNP per capita, Sri Lanka 25000 0.15 20000 0.1 15000 10000 0.05 5000 0 0 Year:Japan Korea 1950 1910 1940 1950 1960 1920 1960 1970 1930 1980 1970 1940 1990 1980 1950 1990 2000 1960 2010 1970 2000 2020 2010 1980 2030 2020 1990 2040 2030 2000 2050 2040 2010 Thailand / Sri Lanka Aging and Economic Growth
100 80 60 Total Government Revenues as % GDP 40 20 0 100,000 100 1,000 10,000 Per capita GDP $ (Log scale) Source: IMF data 2000 Low-income Countries HaveWeak Capacity to Raise Revenues • Governments often raise less than 20% of GDP in public revenues; • The tax structure in many low-income countries is often regressive
Epidemiological Changes Nature of health care (quantity + quality) Not necessarily all public goods Higher service costs Less and less passive acceptance of service ( Customers’ satisfaction, better quality of service) Accountability to be sought after
Major challenges for health financing • Epidemiological transition • Financial constraints • Allocative inefficiency of health sector resources • Lack of management capacity
The International Flow of Development Resources (1) Private foreign investment • foreign direct investment • foreign portfolio investment (stocks, bonds and notes) (2) Public and private development assistance • bilateral and multilateral donor agencies (grants and loans) • nongovernmental organizations (NGOs)
Government Budget 1. Development (Capital) Budget (資本予算) • Domestic Financing • External Financing (development assistance, etc.) 2. Recurrent Budget(経常予算) • Domestic resources (tax, user fees) Absorptive capacity (援助 の吸収能力) Foreign currency portion Local currency portion Localcurrency portion
8 Recurrent Resource Gap (by Y.Uchida) 7 Shortage in recurrent budget 6 5 User Fees 4 Actual Recurrent Budget 3 2 Development (Capital ) Budget 1 0 2000 2001 2002 2003 2004
Recurrent cost constraints threaten the productivity of past investment • A mismatch between capital investment* and recurrent financial capacity (*one-off investment) • “R”co-efficient:the ratio of recurrent expenditure to total investment outlay District hospitals 0.33 every $1000 spent on the initial capital development of a district hospital results in $333 of expenditure per year
external assistance ・Development (capital) budget + recurrent budget ・Foreign currency portion + local currency portion A mismatchbetween capital investment* and recurrent financial capacity (*one-off investment)
Symptoms of the recurrent cost problems New facilities unable to function because of recurrent resources Faculties supplied with equipment but no qualified staff to operate Poorly maintained buildings, equipment, facilities, etc. Transportation difficulties and immobile vehicle fleets caused by lack of spares, fuel, etc. A large number of unfilled posts
Causes for the recurrent cost problems • Poor project design • Weak planning, budgeting and resource mechanisms (dual budgeting, PIP) • Resource availability factors (low per capita income, low growth rates, low savings rations, weak business sectors) • Weak management capacity
Coordination of external resources is central to the development agenda in many countries. The following growing recognitions: Unmanageable proliferation of projects, policies and demands on sector ministries
Unmanageable proliferation of projects, policies and demands on sector ministries Fragmented (overlapped) sector activities = projectisation Little resource fungiblility Several technical specifications Some disbursement rules and financial years among donors Enormous works with donors’ missions – heavy administrative burden Parallel management system
Parallel Management System Excessive separate systems created great confusion. The disbursement and accounting arrangements made financial control very difficult and rendered it impossible to gain an overview of the resources employed or to analyse expenditures. The fragmentation of control over civil works initiatives hindered the development of rational capital planning policies and paid inadequate attention to the aggregate recurrent cost consequences.
Fragmented sector activities Little resource fungiblility Several technical specifications A few different disbursement rules and financial years Enormous works with donors’ mission Asymmetric power relationships Informal networking between key policymakers /managers in both donor and recipient organizations Unmanageable proliferation of projects, policies and demands on sector ministries
SWAps (sector-wide approaches): The concept of coordination, best compressed in the SWAps. SWAps represents a next generation approach to aid, and set out to provide a broad framework within which all resources are coordinated in a coherent and well-managed way .
Definition of SWAps (sector-wide approaches): All significant public funding for the sector supportsa single sector policy and expenditure program, under Government leadership, adopting common approaches across the sector, so as to disburse and account for all public expenditure.
SWAP Arrangements Coordination mechanism: A steering committee: 1) A Code of Conduct which establishes principles and mechanisms on which SWAp is to be based 2) Formulating and sharing a sector policy (a set of medium and long term performance indicators) 3) Allocation of development resources and technical assistance Basket Fund (pooling arrangement)
Six Building Blocks of a Health System Purposeful change aimed at improving health system performance for: System Inputs Source: Strengthening Health Systems to Improve Health Outcomes, WHO’s Framework for Action – WHO 2007 KSM, UOCH 31
Overview of HCF KSM, UOCH 32
Exchange Model Bilateral exchange model for goods Money Consumers Providers Service KSM, UOCH 33
Exchange Model Trilateral Exchange Model for Goods Taxes Treasury Financing Organization Payments Premiums Services Consumers Providers User’s fee KSM, UOCH 34
Determinants of Health Inqualities Generally perceived as unavoidable or fair Generally perceived as avoidable or unfair 1. Natural, biological variation 2. Differential health-damaging behavior that is freely chosen 3. Differential health-promoting behavior that is freely chosen 4. Differential health-damaging or health-promoting behavior, where choices are restricted 5. Differential exposure to unhealthy, stressful conditions (home, work, etc…) 6. Inadequate access to basic social and essential health services 7. Health-related social mobility KSM, UOCH 35
Efficiency Measures Overview It is organized in three tiers Function of Health system esp in Health Care Financing 1. Perspective 2. Output Revenue collection, risk pooling, purchasing Allocative, Technical/ Productive and Social Efficiency 3. Type of Efficiency KSM, UOCH 36
Efficiency Overview Society Health Care Financing Perspective Health Plans Providers Purchasers Individuals Output Revenue collection, Risk pooling Purchasing Technical Productive Type Social KSM, UOCH 37
Pure Private Goods Cosmetic surgery Open heart surgery Curative Kidney dialysis VIP IP care 2nd class IP care OP hospital self-referrals OP hospital referrals Actual funding ends up here Health center OP curative Family Planning Maternal and Child Health Preventive Vector control Environmental sanitation Water supply Pure Public Goods Government policy dictates most resources flow here Public Finance Challenge Poor Rich KSM, UOCH 38