Download
1 / 1
10 likes | 97 Views
Annual and seasonal trends surface ozone background levels at rural French monitoring stations over the 1995-2003 period. Pierre SICARD *, P. CODDEVILLE, S. SAUVAGE, J.C. GALLOO , Ecole des Mines de Douai, Dpt Chimie et Environnement, 941 rue Charles Bourseul, 59508 Douai, France.

E N D
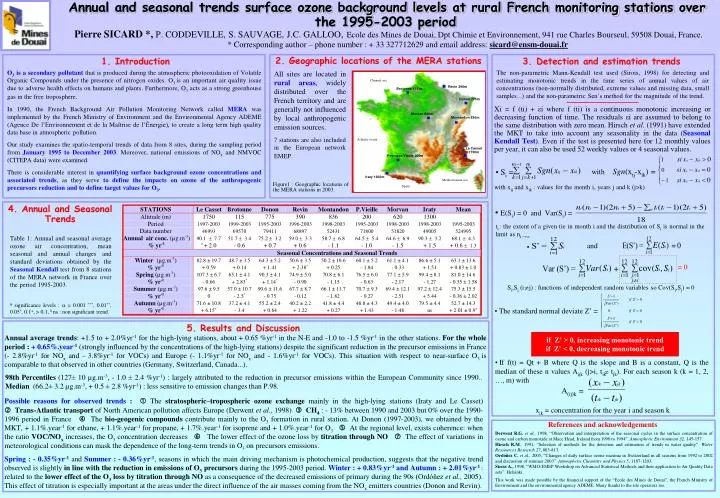
Annual and seasonal trends surface ozone background levels at rural French monitoring stations over the 1995-2003 period Pierre SICARD *,P. CODDEVILLE, S. SAUVAGE, J.C. GALLOO, Ecole des Mines de Douai, Dpt Chimie et Environnement, 941 rue Charles Bourseul, 59508 Douai, France. * Corresponding author – phone number : + 33 327712629 and email address: sicard@ensm-douai.fr 2. Geographic locations of the MERA stations 1. Introduction 3. Detection and estimation trends O3 is a secondary pollutant that is produced during the atmospheric photooxidation of Volatile Organic Compounds under the presence of nitrogen oxides. O3 is an important air quality issue due to adverse health effects on humans and plants. Furthermore, O3 acts as a strong greenhouse gas in the free troposphere. In 1990, the French Background Air Pollution Monitoring Network called MERA was implemented by the French Ministry of Environment and the Environmental Agency ADEME (Agence De l’Environnement et de la Maîtrise de l’Énergie), to create a long term high quality data base in atmospheric pollution. Our study examines the spatio-temporal trends of data from 8 sites, during the sampling period from January 1995 to December 2003. Moreover, national emissions of NOx and NMVOC (CITEPA data) were examined. There is considerable interest in quantifying surface background ozone concentrations and associated trends, as they serve to define the impacts on ozone of the anthropogenic precursors reduction and to define target values for O3. The non-parametric Mann-Kendall test used (Sirois, 1998) for detecting and estimating monotonic trends in the time series of annual values of air concentrations (non-normally distributed, extreme values and missing data, small samples...) and the non-parametric Sen’s method for the magnitude of the trend. All sites are located in rural areas, widely distributed over the French territory and are generally not influenced by local anthropogenic emission sources. 7 stations are also included in the European network EMEP. Xi = f (ti) + εi where f (ti) is a continuous monotonic increasing or decreasing function of time. The residuals εi are assumed to belong to the same distribution with zero mean. Hirsch et al. (1991) have extended the MKT to take into account any seasonality in the data (Seasonal Kendall Test). Even if the test is presented here for 12 monthly values per year, it can also be used 52 weekly values or 4 seasonal values. with Sgn(xij-xik) = Si = Figure1 : Geographic locations of the MERA stations in 2003. with xij and xik : values for the month i, years j and k (j>k) 4. Annual and Seasonal Trends E(Si) = 0 and Var(Si) = ti : the extent of a given tie in month i and the distribution of Si is normal in the limit as ni → . Table 1: Annual and seasonal average ozone air concentration, mean seasonal and annual changes and standard deviations obtained by the Seasonal Kendall test from 8 stations of the MERA network in France over the period 1995-2003. asignificance levels : = 0.001 ***, 0.01**, 0.05*, 0.1+, > 0.1, b ns : non significant trend. and = 0 Si,Sj (i j) : functions of independent random variables so Cov(Si,Sj) = 0 The standard normal deviate Z’ = 5. Results and Discussion Annual average trends: +1.5 to + 2.0%yr-1 for the high-lying stations, about + 0.65 %yr-1 in the N-E and -1.0 to -1.5 %yr-1 in the other stations.For the whole period :+ 0.65%.year-1 (strongly influenced by the concentrations of the high-lying stations) despite the significant reduction in the precursor emissions in France (- 2.8%yr-1 for NOx and - 3.8%yr-1 for VOCs) and Europe (- 1.1%yr-1 for NOx and - 1.6%yr-1 for VOCs). This situation with respect to near-surface O3 is comparable to that observed in other countries (Germany, Switzerland, Canada...). if Z’ > 0, increasing monotonic trend if Z’ < 0, decreasing monotonic trend • If f(t) = Qt + B where Q is the slope and B is a constant, Q is the median of these n values Aijk (j>i, tik tjk).For each season k (k = 1, 2, …, m) with A(ij)k = 98th Percentiles (127± 10 µg.m-3, - 1.0 ± 2.4 %yr-1) : largely attributed to the reduction in precursor emissions within the European Community since 1990.. Median (66.2± 3.2 µg.m-3, + 0.5 ± 2.8 %yr-1) : less sensitive to emission changes than P.98. Possible reasons for observed trends : The stratospheric–tropospheric ozone exchange mainly in the high-lying stations (Iraty and Le Casset) Trans-Atlantic transport of North American pollution affects Europe (Derwent et al., 1998)CH4: - 13% between 1990 and 2003 but 0% over the 1990-1996 period in France The bio-geogenic compounds contribute mainly to the O3 formation in rural station. At Donon (1997-2003), we obtained by the MKT, + 1.1%.year-1 for ethane, + 1.1%.year-1 for propane, + 1.7%.year-1 for isoprene and + 1.0%.year-1 for O3At the regional level, exists coherence: when the ratio VOC/NOx increases, the O3 concentration decreases The lower effect of the ozone loss by titration through NO The effect of variations in meteorological conditions can mask the dependence of the long-term trends in O3 on precursors emissions. xik = concentration for the year i and season k References and acknowledgements Derwent R.G. et al., 1998, “Observation and interpretation of the seasonal cycles in the surface concentration of ozone and carbon monoxide at Mace Head, Ireland from 1990 to 1994”. Atmospheric Environment 32, 145-157. Hirsch R.M., 1991, “Selection of methods for the detection and estimation of trends in water quality”. Water Ressources Research 27, 803-813. Ordóňez C.et al., 2005, “Changes of daily surface ozone maxima in Switzerland in all seasons from 1992 to 2002 and discussion of summer 2003”. Atmospheric Chemistry and Physics 5, 1187-1203. Sirois A., 1998, “WMO/EMEP Workshop on Advanced Statistical Methods and their application to Air Quality Data sets”. Helsinki. This work was made possible by the financial support of the “Ecole des Mines de Douai”, the French Ministry of Environment and the environmental agency ADEME. Many thanks to the site operators too. Spring : - 0.35%yr-1 and Summer : - 0.36%yr-1, seasons in which the main driving mechanism is photochemical production, suggests that the negative trend observed is slightly in line with the reduction in emissions of O3 precursors during the 1995-2003 period. Winter : + 0.83%yr-1 and Autumn : + 2.01%yr-1: related to the lower effect of the O3 loss bytitration through NO as a consequence of the decreased emissions of primary during the 90s (Ordóňez et al., 2005). This effect of titration is especially important at the areas under the direct influence of the air masses coming from the NOx emitters countries(Donon and Revin).