Download
1 / 105
1.05k likes | 1.16k Views
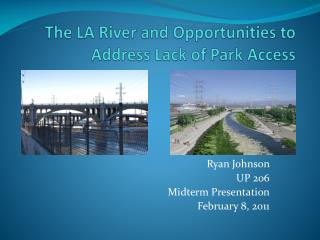
State Program Training 2010 Division of Nutrition, Physical Activity and Obesity (DNPAO). Park Access. March 19, 2010. Dee Merriam, FASLA Community Planner National Center for Environmental Health U.S. Centers for Disease Control and Prevention.

E N D
State Program Training 2010 Division of Nutrition, Physical Activity and Obesity (DNPAO) Park Access March 19, 2010 Dee Merriam, FASLA Community Planner National Center for Environmental Health U.S. Centers for Disease Control and Prevention “The findings and conclusions in this presentation have not been formally disseminated by the Centers for Disease Control and Prevention and should not be construed to represent any agency determination or policy.” F:\# Active Files\CDC\Conferences\2009 Oct 26-28 - NEPH -Atl\PP development
“No Place To Play”The Trust for Public Land 2004 study of children’s access to parks. Los Angeles Boston 97% Los Angeles 33%
toinks.blogdrive.com/ When you are walking – Distance Matters http://www.swanydesign.com/ReturnToOz/
Radial versusNetwork Analysis A X .25 mile radius PP slide courtesy of Doug Allen
Objective Using the City of Atlanta park system examine the difference in estimates of population served resulting from park service areas drawn using radial and network analysis.
Methods • Major Tasks: • 1. Obtain GIS layer showing park boundaries • 2. Identify eligible parks • 3. Develop a typology of entrance types • 4. Map entrances on air photos • 5. Establish service areas • - .25 and .5 mile radial and network service areas for each park and the city as a whole • 6. Assign population to park service areas • - used 2000 census data and proportional weighting
Entrance Typology: Entrance Typology All- Primarily automobile but can serve pedestrians and maintenance vehicles Pedestrian -Serves only pedestrians – no motorized vehicle access Maintenance - Maintenance entrance only – usually gated Pedestrian/Maintenance - Maintenance entrance but pedestrian access is possible (no gates) Potential Pedestrian - No definitive entrance but terrain permits access
Mapping Entrances • Located entrances using air photos • Field verified 61 parks Central Springvale
Potential Pedestrian Access Points - Points along park boundary where entrance to park is possible (permitted by terrain) but no formal entrance exist - Usually placed at park corners - Not placed between existing entrances unless entrance fronts a street
Create Park Service Areas • Radial Buffer – draw polygon .25 mile from park boundary • Network Buffers Measure .25 mile along street network from entrances Black dots represent end points .25 mile from closest entrance
Create Park Service Areas½ and ¼ Mile Network Buffers One Service Area per entrance is created (blue outlines) by connecting end points
Create Park Service Areas • “Dips” are where two Network • Service Areas meet • Individual Service Areas are merged into one PSA per park • Results in oddly shaped Service Area (blue outline)
Findings 154 Parks (out of 345) met the study criteria that there must be a reason to enter the park. - A park bench, - A trail, - An open field, etc. Parks ranged from .042 acres to 250 acres 18 parks were less than .5 acres
Park Service Areas for the City as a Whole Radial Estimate of Population Served ¼ mile = 44% ½ mile = 79% Source: Center for Geographic Information Systems, Georgia Institute of Technology
Park Service Areas for the City as a Whole Street Network Estimate of Population Served ¼ mile = 21% ½ mile= 51% Source: Center for Geographic Information Systems, Georgia Institute of Technology
51% 44% 21% 79% City as a WholeEstimates of Population Served
Correlation between Radial and Network Population Estimates for Specific Park Sites • Least Correlation ---- .5% (Brownsmill) • Median ------------------ 44.8% (Orme) • Greatest Correlation - 81.8% (Hardy Ivy) % of radial population within network service area (network est/radial est)
Least correlation – Brownsmill .5% Population within the .25 mile radial buffer = 2,613 Population within the .25 mile street network = 13
Greatest Correlation- Hardy Ivy 81.8% Population within the .25 mile radial buffer = 482 Population within the .25 mile street network = 394
Most Population Served- Freedom Park Population within the .25 mile radial buffer = 10,524 Population within the .25 mile street network = 6,851
Limitations • Assumes that population is equally distributed within census block groups • May miss access points (undercount) or identify entrances that are not usable (overcount.) • Assumes all streets are walkable. • Assumes that all parks provide equal service
Find Service Gaps Radial Network
Illustrates where access points can be added. Population within .25 Radial Service Area = 4,311 Population within .25 mile Street Network Service Area = 2,439
Illustrates where access points can be added. Population within .25 Radial Service Area = 4,311 Population within .25 mile Street Network Service Area = 2,439
Illustrates impact of adding a street. Population within .25 Radial Service Area = 743 Population within .25 mile Street Network Service Area = 25
Illustrates impact of adding a street. Population within .25 Radial Service Area = 743 Population within .25 mile Street Network Service Area = 25
Conclusions • In all cases radial analysis overstated service • At the system scale more precise maps provide clearer representation of service gaps • Distance tended to reduce the discrepancy between the radial and network estimates • At the site scale graphics illustrate where entrances can be added to expand service • Graphics show where street connectivity can be added to expand service
Placing parks within a walkable distance Make Active Transportation --Easy
Park Park Access to parks--- Destinations 3 2 1 Geographic Location Location in relation to the street • Have a park– some place to go • Give the park street frontage • Make the park easy to get to from many points in the neighborhood.
Open Space located in the back of lots is not visible or accessible. Street House Back Yards House Street Public Realm Public Realm
Open Space that is commonly owned and highly visible and accessible. House Street Park Street House Public Realm
Place park for maximum visibility and access. • Open Space fronts street • Lots are across the street which gives community access. • Connecting streets direct views to open space • Narrow lots front the greenspace. • Highest premium for lots with greatest access. Open space fronts street. It is highly visible and accessible.
Putting the Principles to Work Original Site Concept • Access is through access alleys and likely around dumpsters. • Limited points to view the natural area. • Few of the residents have access. • The site is isolated.
Putting the Principles to Work Revised Site Concept • Main Road fronts the open space. • Maximum natural surveillance • All residents have equal access. • The open space becomes a significant amenity.
Walk route distance is important ! A X Dee Merriam 770-488-3981 dmerriam@cdc.gov www.cdc.gov/healthyplaces .25 mile radius PP slide courtesy of Doug Allen
F:\# Active Files\Photos\Research Photos\12-06 for Atlanta flyer/McKinley-Wilson Triangle – 5-05