Download
1 / 13
130 likes | 259 Views
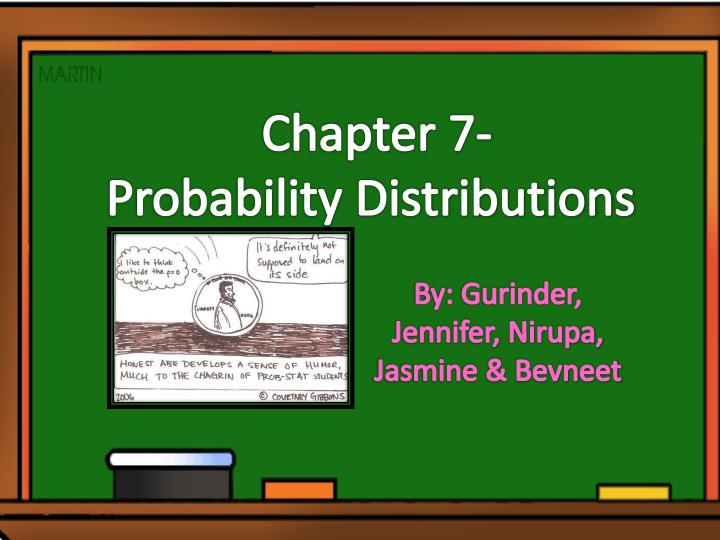
Chapter 7- Probability Distributions. By: Gurinder, Jennifer, Nirupa, Jasmine & Bevneet. 7.1- Probability Distributions. Look at the entire probability distribution which list all possible outcomes

E N D
Chapter 7- Probability Distributions By: Gurinder, Jennifer, Nirupa, Jasmine & Bevneet
7.1- Probability Distributions • Look at the entire probability distribution which list all possible outcomes • The possible outcomes could be the same or could be different, but MUST add up to 1 (100%) • Random Variable (RV X) is used to define each outcome in the distribution • Continuous Random Variable X • Have infinite possible # of values • 2. Discrete Random Variable X • Have separate and equally distant values
There are 5 different types of discrete probability distribution and the 1st one is- “Uniform Probability” (when all outcomes are equally likely) • P(X = x)= 1/n(n is # possible outcomes) • E(x)= [x1 P(x1)] + [x2 P(x2)] +…+ [xn P(xn)] “Generic Non- Uniform Probability” (when the possible outcomes are not all equally likely) • Use the same formula
Example: • In a game, a fair die is rolled and if the player roll a even #, they gain those points. But if they roll a odd #, they also lose that many points. What is the expected # of points you win or lose?
7.2- Binomial Distributions • Made up of Bernoulli Trials that is measure by success/ failures • Probability of failure/success is the same in every trial • All trials are independent and identically distributed (i.i.d) • Random Variable (X) is the # of successes in a given number of trials Binomial Distribution Formula P(X=x)= (nCx)pxqn-x • p= probability of success/ q= probability of failure • n= total # of trials • x= # of success
Expected # of successes in n independent trials E(x)= np • Example: • Nick is playing football with his friends on team A. There is a 65% probability that the team B will catch the ball. If the ball is thrown 3 times in this game determine the probability distributions that Nick’s team (team A) will catch the ball.
7.3- Geometric Distributions • In nature, there are situation where there is a waiting time before something occurs (Think of it as: # of rolls of a die BEFOREgetting a 6) • Waiting time: the number of Bernoulli trials before the successful outcome occurs. • The Random Variable X is the waiting time (Where X is the # of fails before success occurs) • There are a variable number of trials which means failures can occur so many times before success occurs (Where as in binomial distribution, there was a fixed # of trials)
To find the probability in a geometric distribution P(X=x) = qx p • x= number of failures (wait time) • p= probability of success • q= probability of failure • Expected Waiting time- E(x) =q/p
Examples- • Suppose that 1 out of 50 cards in a scratch and win promotion gives a prize. • What is the probability of winning on your fourth try? • What is the expected number of cards you would have to try before winning?
7.4- Hypergeometric Distributions • The probabilities for each trial are no longer equal, now each trial is dependent • Even though the trials are dependant, the outcomes still contains success and failure • The probability of success changes as each trial is made • Formula-
Example- • There are 60 grade ten students at Eagle Secondary School. 45 of them are taking Media arts. At a recent school survey wide assembly, 8 of them are selected at random. Find the probability that 5 are taking media arts. Answer: Success= taking media arts RV X= # of students taking media arts a=45 n=60 r=8 x=5 P(X=5)= (45C5)(60-45)8-5 (60C8) = 0.217
Difference b/w distributions • Uniform is used when all the possible outcomes are equally likely • Binomial is used when the trails are based on a fixed #of trails (which is measured in success and failures) • Geometric is used when there is a waiting time [NOT FIXED #] (you would be measuring the # of trails before getting success) • Hypergeometric is used when the possible outcomes are depended on one another (when the 2nd success depends on what happens with the 1st)
Which of the following situations can be modeled by a binomial distribution? (a) A child roles a die ten times and counts the number of 3s (b) The first player in a free-throw basketball competition has a free-throw success rate 88.4%. A second player takes over when the first player misses the basket. (c) A farmer gives 12 of the 200 cattle in a herd an antibiotic. The farmer then selects 10 cattle at random to test for infections to see if the antibiotic was effective. (d) A factory producing electric motors has a 0.2% defect rate. A quality-control inspector needs to determine the expected number of motors that would fail in a day's production.