Download
1 / 24
240 likes | 373 Views
4. HYDROGEOGRAPHY Key Concepts : Water Budgets Geography of water Global disposition Local w atersheds Local hydrologic budget components Water Balance Prediction (genetic, generic) Management Practices (flood plain mapping), Best Management Practices.

E N D
4. HYDROGEOGRAPHY • Key Concepts: • Water Budgets • Geography of water • Global disposition • Local watersheds • Local hydrologic budget components • Water Balance Prediction (genetic, generic) • Management Practices (flood plain mapping),Best Management Practices
Water Balance Prediction; Genetic Approaches • before runoff can occur, precipitation must satisfy the capacities of interception, surface detention, soil moisture, evapotranspiration, interflow and ground water • For any time period or event (storm or snowmelt episode) the absolute capacities and antecedent moisture storage conditions must therefore be determined • This necessitates ongoing monitoring of the cascade of stores, so that the available water-holding capacity of each storage is known • If stores are full prior to precipitation then more water will run off than if they had only been half full • Maintaining records of how much water-retaining storage capacity remains at any point in time is a challenge as is the lag in the contribution of frozen precipitation to stream flow
Water Balance Prediction; Genetic Approaches • Rain falling on frozen ground may create immediate runoff, however if it freezes on impact, there may be no runoff until it melts • the hydrologic budget under these conditions is therefore very intimately tied to the energy budget • with complete knowledge, then the inputs, storages, transfers, transformations and outputs would be additive (mass balance): • P = I + DS + SM + GW + IF + ET + S • however, routine measurements are restricted to precipitation and runoff • given the difficulties of monitoring storages to produce meaningful records spread over time and space, modelling has been undertaken to find readily available surrogate measures • e.g., what are the shifts that take place over the course of a storm, as the disposition of precipitation changes from primarily interception and soil-surface absorption, to infiltration, interflow and runoff as capacities are reached?
Water Balance Prediction; Genetic Approaches • models must also contend with the differences between: • light rain which may only generate runoff if prolonged, and • heavy rain which will produce runoff, except if all storages have been emptied • There are also differences among: • initial spring melting episodes • sudden and rapid melting, and • melting accompanied by spring rain storms • differences in land use, geology, soils, slopes and vegetative cover also significantly affect responses to these runoff conditions, depending on their permeability etc. • watersheds must therefore be modelled and calibrated separately • water usage (agricultural, horticultural (golf), domestic, municipal or industrial extraction) and land use changes are also factors that the models must accommodate • only because the implications are so important, are efforts made to model so thoroughly, but to be used, models must be simple
P ET Water Balance Prediction; Genetic Approaches Storm Sewers DS • e.g., simplifying the water budget by aggregating all precipitation “depletions” together by: • type of land cover • steepness • extent of impervious ground cover • soil texture • land use etc. SM S High and Low flows
Water Balance Prediction; Genetic Approaches • The Rational Method: Q = 0.0028 C i A • allows calculation of the peak flow rate (Q) on a channel • by relying on Runoff Coefficients that have been developed to represent the expected proportion (C) of rainfall (i = rainfall intensity, in mm/hr) that will run off from the area (A, in m2) drained to a specified point, • tables of C are published widely and customized to the local circumstances of specific jurisdictions • http://www.mto.gov.on.ca/english/engineering/drainage/section10.htm#flowrate • primarily used as a design tool for the design of minor drainage systems such as storm sewers and ditches • mostly applied to an urban catchment (<50 Ha), but also rural watershed drainage areas less than 100 ha • where the variability in soil, vegetation or rainfall is minimal
P ET Water Balance Prediction; Genetic Approaches: The Rational Method From City of Brampton http://www.city.brampton.on.ca/city_dept/works_trans/Development_Services/Subdivision_Construction/Subdesignstandard.pdf DS Storm Sewers SM S High and Low flows GW
Water Balance Prediction; Genetic Approaches: The Rational Method • runoff has a genetic basis in the overall hydraulic conductivity of a basin • assumption is made that the specific conditions of any area are the same as in other areas with the same perviousness circumstances • in practice, judgment is required in selecting from a range of precise coefficient values to apply in a specific situation • this may undermine confidence that the approach is reliable (consistently reproducible) and accurate (close to reality). • with more categories of land surface, greater accuracy in prediction is expected • subtle increments the coefficient if higher-magnitude (less-frequent) events are the basis for runoff prediction or, if snowmelt is involved http://www.th.gov.bc.ca/bchighways/operations/hwyeng/bridge/hydrology/hydrol2.doc
Water Balance Prediction; Generic Approach • an alternative approach to prediction is to adopt a purely statistical approach: • the frequency of discharge values in the past is the basis for prediction of values in the future • rather than indicating the day-to-day expected discharges, this approach defines a standard condition – the maximum runoff expected over a given time period – based on the frequency of peak (annual) flows already experienced over the period of monitoring • by ranking these runoff events over the period of discharge monitoring, and converting frequency into periodicity (called the "recurrence interval") for each discharge magnitude, an expected flow is based on the probability of it happening again
Water Balance Prediction; Generic Approach • This is normally used to interpolate the magnitudes of floods for major recurrence periods floods, and to extrapolate for longer "design" periods • Data is almost always based on longitudinal study: • observing floods over time for N years • measuring peak discharge (Qmax) annually (the highest flood for each year) • ranking these peak annual floods from the very highest ever (1st) to the lowest of the annual maxima (Nth, indicating that every year its peak flow has been exceeded) • converting the frequency distribution to a probability-based return period (recurrence interval, in years) calculated as: • R=(N+1)/M • the number of years expected between when a flood of a given magnitude is expected to be matched or exceeded
Water Balance Prediction; Generic Approach Hypothetical Case (N=29) excerpt:
Water Balance Prediction; Generic Approach Hypothetical Case (N=29) excerpt:
Water Balance Prediction; Generic Approach By plotting the recurrence interval by actual peak annual discharge, extrapolation to standard longer-term return periods (50-hr or 100-yr) can be accomplished
P ET Water Balance Prediction; Generic Approach • From the graph relating discharge to flood elevations (Stage-discharge diagram) the elevation of the flood line for the two design events can be mapped and depicted on cross-sections • Below the 100-year flood line, sites are at risk of flooding at least once in every 100 years. Only certain land uses and construction methods are permitted to expose the public to this hazard to human life and/or property DS Storm Sewers SM S High and Low flows GW IF
Water Balance Prediction; Generic Approach • However • in calculating the recurrence interval, precision is limited by the number of years of record, not the actual magnitude of peak annual discharge • like all summary statistics, much is overlooked in distilling the data • for instance, the peak flow may have been nearly reached several times in some years and only once in others • the peak value in one year may well have been exceeded several times in other years • basin conditions may well have changed over the period of monitoring • the N-year set of observations may not be representative of what to continue to expect from the discharge record • a storm with a likelihood of once in 100 year may or may not have occurred during the period of record • conversely, back-to-back small storms may produce as much runoff as one very large one
Water Balance Prediction; Generic Approach • climate shifts may occur due to: • inherent variability or progressive change • natural or human-induced changes of genetic water-balance components in the drainage basin • erosion • sedimentation • water-taking • land cover changes • agricultural expansion/contraction • urbanization • reforestation • quarry operations, etc. • calculation of recurrence is primarily used in prediction of flood peaks • other water-balance concerns are overlooked: • low flows • groundwater recharge • soil moisture demand etc.
Water Balance Prediction; Generic Approach • The strength of recurrence interval use is that it allows standards to be applied. The 2-year, 50-year and 100-year or even longer-recurring discharges are widely used as standards for engineering design of water-management facilities and imposition of land use restraints. • Unfortunately, the standard is unevenly applied: some jurisdictions find the “design-storm” criteria too restrictive for their liking and have arbitrarily established other less-restrictive bases for flood management • in Ontario, the "Hurricane Hazel events (1954),” the "Timmins event (1961)" and the 100-year storms are widely used as standards for designing flood-risk responses, as part of provincial policies on hazard management (http://www.mnr.gov.on.ca/MNR/pubs/nat_haz2.pdf) • the County of Oxford, for example overlaps in its jurisdiction with four conservation • authorities, with the following “Design Storms”: Grand River Conservation Authority- Regional Storm (Hurricane Hazel) Long Point Region Conservation Authority- 100 Year Event • Catfish Creek Conservation Authority- Regional Storm (Hurricane Hazel)
Water Balance Prediction; Generic Approach • This kind of regulation for the public good is regarded by some people as an imposition on individual property rights • Since emergency response and public safety are accepted as social responsibilities in most societies, protection from flood risk has only occasionally been controversial. • Failure to protect, as in the case of Hurricane Hazel is more of an issue, and society continues to pay a very high price for flood damage and prediction/response infrastructure: (http://sciencepolicy.colorado.edu/socasp/data/tables1.html, http://www.nws.noaa.gov/oh/hic/flood_stats/index.htm,lhttp://www.worldbank.org/dmf/operations.htm , http://www.disastercenter.com/flood.htm , • http://iwin.nws.noaa.gov/iwin/us/flood.html, http://www.mscsmc.ec.gc.ca/airg/doc/hogg.html ). • Definition of flood hazard lands is therefore taken seriously since it does impose restrictions • on personal freedoms in regard to what activities are permitted on a parcel of land.
Water Balance Prediction; Generic Approach • Management decisions therefore have focused not only on the lands susceptible to flooding, but on managing the water itself, with implications for low-flow conditions and water quality. Finding the best management practice for a given situation is often the issue • Both the Rational Method and Recurrence Interval are widely used for flood prediction, the former in designing engineering works and the latter for both engineering of stormwater conveyance and for land use planning to identify and avoid hazard lands. • Early engineering works were primarily structural solutions to high flow: designing and building to “fix the problem” of flooding • Regulations have been developed to ensure that bridges and culverts will accommodate expected discharges:
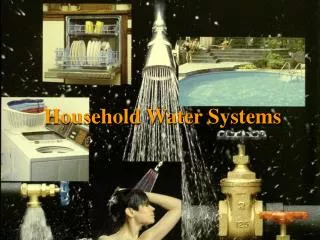
Management Practices: Best Management Practices Hazard lands are often held in public ownership as parks (passive-use open space) which also serve as flood-conveyance and storage facilities:
Stormwater management: Best management practices (BMP) for stormwater management (SWM) may include the following:
Stormwater management Practices: $ http://www.city.toronto.on.ca/sewers/storm.htm
Stormwater management Practices: $ http://www.toronto.ca/greenroofs/pdf/executivesummary.pdf