Download
1 / 41
410 likes | 574 Views
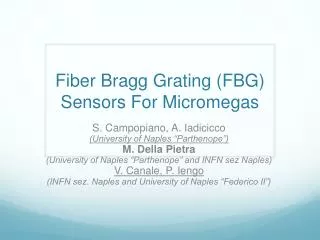
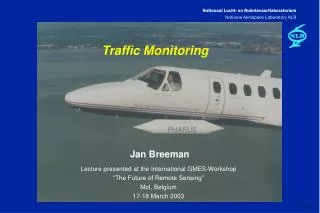
Hands-On Sensor Course April 22, 2004 Marley Kunzler Blue Road Research 376 NE 219th Avenue Gresham, OR 97030 (503) 667-7772 *. Traffic Monitoring Using FBG Sensors. Outline. 1. Functionality of the Dynamic FBG System 2. Background on Project 3. Results from Testing

E N D
Hands-On Sensor Course April 22, 2004 Marley Kunzler Blue Road Research 376 NE 219th Avenue Gresham, OR 97030 (503) 667-7772 * Traffic Monitoring Using FBG Sensors
Outline 1. Functionality of the Dynamic FBG System 2. Background on Project 3. Results from Testing 4. Summary & Future Work
Functionality of the Dynamic FBG System Light is launched through the core of a fiber optical strand to the grating
Functionality of the Dynamic FBG System As the fiber undergoes tension & compression, the grating spacing changes
Functionality of the Dynamic FBG System The grating’s reflection is spectrally demodulated
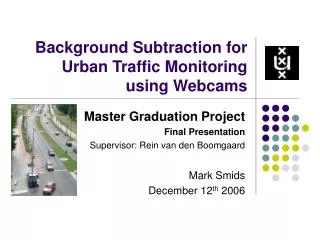
Overview Leading up to First Freeway Install • In July, 1999 Oregon Dept. of Transportation contracted Blue Road Research to develop a traffic sensor (based on fiber optic sensor technology) which is more durable, reliable and cost\installation effective than traditional sensing methods. • The primary focus of the contract: a sensor for vehicle classification and counting, (flexibility for other traffic sensing applications). • After preliminary testing on a concrete and asphalt testpad, sensors were installed in the Interstate 84 freeway East of Portland, Oregon on August 1, 2001.
Blue Road Research Goals: • Create and Demonstrate a Fiber Optic Traffic Sensing System • Count and Classify Traffic Using Fiber Optic System • Test Ruggedness of Sensors for Freeway Use • Determine Optimal Installation Procedures • Develop an Enhanced Traffic Sensor Product Line
Final Layout (Sensors Area) Sensing Area Junction Box Fiber Backbone Line Bicycle path On Ramp 207th Overpass Sensors are approx. 7 feet apart in left wheel lane. n l m k Sensor 5 (diagonal) monitors temperature. j
Grooving 205th Avenue to Enable Fiber Optic Installation & Remote Monitoring
Installation of the Traffic SensorsInto Portland Cement Concrete
Filling the Sensor Grooves with Bituminous Hot Melt (~375° F)
Installation of the Traffic System Network Buried Fiber Lines
Data Collected from Semi Trailer Relative Amplitude vs. Time
Conclusions & Future Work Costs prohibitive for traffic classifier, but not Weigh-in-Motion (WIM) Development under NSF of up to 12 channel self-tuning readout system suitable for freeway Pursuing funding for WIM research
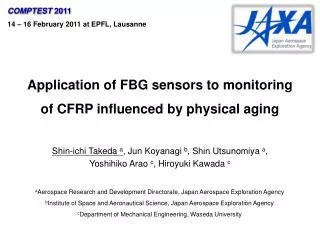
Modal Analysis of Bridges Using Fiber Bragg Grating Sensors • Background • Long gage length fiber Bragg grating sensors • Modal Analysis • Full scale field test, 2002 • Current work • Blue Road Research multiplexed FBG system • Laboratory Experiments • Fairview Model Bridge • Broadway Bridge work • Summary Session 6, Page 64
Acknowledgements • National Science Foundation • STTR Grant No. DMI-0131967 • Caltrans • Support of full scale field test • Oregon DOT • Continuing support of civil structures research ODOT • Multnomah County Bridge Section • Support of upcoming bridge system deployment Session 6, Page 65
Long Gage Length Fiber Bragg Grating Sensors: Packaging One meter gage length Aluminum bulkheads for anchor points Rugged housing Session 6, Page 66
Modal Analysis (1 Degree of Freedom) c k f Max Re (G(w)) Re (G(w)) x m wa wb w Min Re (G(w)) Im (G(w)) wn w I Session 6, Page 67
Modal Analysis (1 Degree of Freedom) w Max Re (G(w)) Re (G(w)) w wa wb Min Re (G(w)) Im (G(w)) wn I Tongue, Benson H. Principles of Vibration. Oxford University Press: Oxford. 1996. 101. Session 6, Page 68
Modal Analysis (multi-DoF) Mode 1 Mode 2 Mode 3 Re (G(w)) w Im (G(w)) w F Sensor Session 6, Page 69
Modal Analysis (multi-DoF) Im (G(w)) I First Mode Shape w I7 I1 I6 I2 I5 I3 I4 x y F1 F2 F3 F4 F5 F6 F7 x Sensor Session 6, Page 70
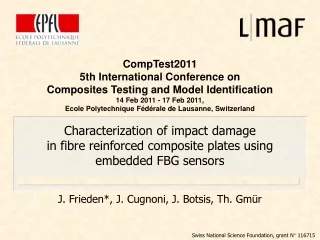
Experimental Validation of the Approach: 2002 Carbon Splice Test • 30’ composite wrapped concrete beam with splice at midspan • Test performed by UCSD, FHWA, CALTRANS • Blue Road Research and UCSD • Placed optical sensors on the beam • Performed dynamic tests Session 6, Page 71
Carbon Splice Test: I-5 Gilman Bridge Session 6, Page 72
Carbon Splice Test: Mode Shapes Session 6, Page 73
Carbon Splice Test: Modal Vectors Session 6, Page 74
Conclusions from Splice Test • Strong agreement between accelerometer and FOS data • Validates use of Long Gage FOS in system identification • Clear changes in modal characteristics with damage • Suggests that this method will work for detecting structural damage in bridges Session 6, Page 75
Current Work • Algorithm refinement by UCSD • Enable location and quantification of damage through system identification • Hardware development for sensor data acquisition • Acquire data from eight sensors simultaneously with sub-microstrain resolution • Full scale deployment on the Broadway Bridge in Portland, Oregon • in planning with Multnomah County Bridge Section Session 6, Page 76
Laboratory Tests: Instrumented I-Beam Session 6, Page 77
Laboratory Tests: Parked and Sweeping Etalon Parked Sweeping Session 6, Page 78
Laboratory Tests: Parked Etalon Session 6, Page 79
Field Tests: BRR Fairview Bridge • Environmental Effects • Temperature • Wind • Performance • Modal Analysis with controlled damage • Quasi-static loading • 20’x4’ steel truss • Concrete and composite deck • Sensors installed in concrete • Sensors planned for installation on structure and in composite section Session 6, Page 80
Blue Road Research Health Monitoring and Seismic Damage Assessment System Session 6, Page 81
Cable Routing from Readout Unit to Sensors Multi-Strand cable, running from Readout Unit to Bridge Eight strings of 5 sensors Junction Box-Mounted on bridge Session 6, Page 82