Download

1 / 20
200 likes | 336 Views
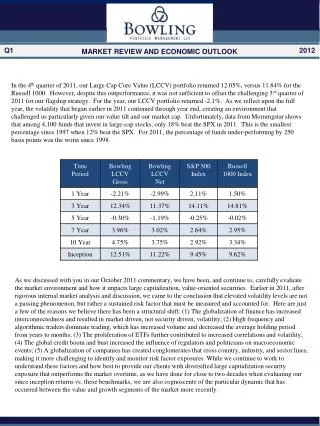
Financial Market and Economic Outlook Richard Kaglic April 15, 2010. Federal Reserve System Assets. $, Billions. Term ABS Lending Facility (TALF): $47. TALF: $48. CPFF: $8. Total: $2,352. Total: $2,349. Term Auction Facility (TAF): $3. AIG & Bear Stearns: $115.

E N D
Financial Market and Economic Outlook Richard Kaglic April 15, 2010
Federal Reserve System Assets $, Billions Term ABS Lending Facility (TALF): $47 TALF: $48 CPFF: $8 Total: $2,352 Total: $2,349 Term Auction Facility (TAF): $3 AIG & Bear Stearns: $115 AIG & Bear Stearns: $116 TAF: $3 CPFF: $8 Miscellaneous: $155 Miscellaneous: $154 Discount Window: $11 Discount Window: $7 Agency MBS: $1,067 Agency MBS: $1,069 Agency Debt: $168 Agency Debt: $169 Treasury Securities: $777 Treasury Securities: $777 Notes: CPFF is the Commercial Paper Funding Facility. Source: Board of Governors/Haver Analytics
Capital Market Rates Percent Corporate BBB Bond Rate 30 Year Conventional Mortgage Rate Apr. 9 Corporate AAA Bond Rate 10-Yr. Treasury Bond Rate Source: Merrill Lynch, Board of Governors, Haver Analytics
S&P 500 Volatility Index Imputed Volatility Source: CBOE, Haver Analytics
Industrial Production Index: Manufacturing 2002 = 100 Feb. 99.1 Source: Board of Governors/Haver Analytics
ISM: Business Survey Indexes DIFFUSION INDEXES: Numbers above 50 percent indicate a preponderance of expanding firm activity. Source: Institute for Supply Management/Haver Analytics
Nonfarm Payroll Employment Quarterly average of monthly changes, Thousands of persons Q1 Avg. Source: Bureau of Labor Statistics/Haver Analytics
Nonfarm Payroll Employment Millions of persons Temporary Help (Left Axis) Total (Right Axis) Source: Bureau of Labor Statistics/Haver Analytics
Consumer Price Indexes Year over Year % Change All Items Mar. 2.3% 1.1% Core CPI Source: Bureau of Labor Statistics/Haver Analytics
Personal Income & Expenditures Year over Year % Change Real Personal Income Month over Month % Change Income Expenditures DecJanFeb 0.3 0.1 0.0 0.2 0.2 0.3 Real Personal Consumption Expenditures Feb. Notes: December 2004 real personal income figure excludes the Microsoft dividend. Source: Bureau of Economic Analysis/Haver Analytics
Residential Single-Family Building Permits Millions of Permits Average Annual Building Permits: 1990 through 1999 Feb. 0.50 mil. Source: Census Bureau/Haver Analytics
Business Inventory/Sales Ratio Percent Retailers Total Business Manufacturers Source: Census Bureau/Haver Analytics
Core Capital Goods Current $, Billions New Orders Shipments Feb. Notes: Core capital goods are nondefense capital goods excluding aircraft. Source: Census Bureau/Haver Analytics
Construction Put In Place Millions of $ (SAAR) Source: Census Bureau/Haver Analytics
Exports Current $, Millions Source: Census Bureau/Haver Analytics
Real Gross Domestic Product Percent change from previous quarter at annual rate Q4 5.6% MA Forecast Source: Bureau of Economic Analysis/Haver Analytics
Alternate Measures of Labor Underutilization Percent of Working Age Population Source: Bureau of Labor Statistics/Haver Analytics
Small Business Sentiment Index Source: National Federation of Independent Businesses
The Outlook • Recovery continues to firm, pace of growth is muted • Financial markets healing • Business activity continues to gain traction… • …jobs recovery likely in second half, adds more durable support to economic recovery • Second quarter may be the “acid test” • Price pressures remain subdued • Excess capacity keeps pressure off inflation • Near term outlook for fed funds rate unchanged • Extraordinary policy operations winding down