Download
1 / 1
10 likes | 232 Views
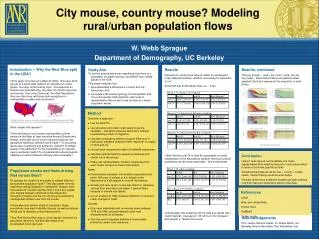
City mouse, country mouse? Modeling rural/urban population flows. W. Webb Sprague Department of Demography, UC Berkeley. Introduction -- Why the Red/ Blue split in the USA?

E N D
City mouse, country mouse? Modeling rural/urban population flows W. Webb Sprague Department of Demography, UC Berkeley Introduction -- Why the Red/ Blue split in the USA? There seem to be two very different USA’s. One sees itself as part of a world-wide network of culturally rich urban places, the other is trenchantly local. One depends on finance and manufacturing, the other on natural resources and tourism. One votes Democrat, the other Republican. And one often lives (with important exceptions) in metropolitan counties and one doesn’t. What creates this dynamic? There has been a rural versus cosmopolitan cultural tension in the West at least since the Ancient Greeks with Hesiod. Is the split due to a set of physical features like agriculture leading to different world views? To circulating discourses of authority and patriarchy (Lakoff)? To simple quality of life attributes? To the machinations of culturally savvy neoliberal media? To a fundamental cultural dialectic reflecting a tension between intimacy and universality? Results Exposure to rurality does have an effect on subsequent rural residential choices, whether accounting for education or not (Note that that all the tables have a p ~ 0.00) I think that the rural 79 to rural 96 association is mostly independent of the educational variable, leaving a cultural explanation as the most reasonable. See below tables. Unfortunately, the clustering did not yield any results that I could interpret. Average s(i) .63 wth k=2, then dropped with greater k. Needs more work. Results, continued The four groups -- rural + ba, rural + noba, city+ba, city+noba -- show distinct lifecourse patterns when graphed. Each bar represents the proportion in each phase. Study Aim To test the anecdotally driven hypothesis that there is a population circulation among “countrified” and “citified” places in the USA. This project requires that we substantiate a difference in country and city lifecourses, and we create a life course typology of cosmopolitan and non-cosmopolitan USA residents, with a set of representative lifecourses to use as input to a macro population model. • Method Overview of approach: • Use the NLSY79, • use education and urban rural residence as the variables -- education because exploratory analysis revealed large effect on migration. • calculate contingency tables to support difference in rural urban migration between those “exposed” to rurality in 1979 and not, • convert each respondent’s data to TraMineR sequences, • calculate optimal matching sequence distances and cluster into a few groups, • finally, use representative “medoid” sequences from each cluster as input to macro calculations. Notes: • Dichotomised education into whether respondent ever attain 16th year of college or not, based on the importance of a BA degree for overall life chances. • Gender and race seem to have less effect on residence choices than education and region; I ignored them because of sample size issues. • Cut off analysis at 1996, because definition of rural and urban changes in 1998. Caveats: • Only used individuals with no missing years between 1979 and 1996, and well defined urban rural measurements for all waves. • Can’t be sure if migration behaviour is accurately proxied by urban/ rural residence. Red blue map: http:www-personal.umich.edu/~mejn/election/2008/countymapnonlinr1024.png Non-Metro counties: http://www.ers.usda.gov/Emphases/Rural/Gallery/nonmetrocounties.htm Conclusion Haven’t quite figured out the details, but I have substantiated what might be termed a “rural culture effect” in terms of concrete population flows. Georeferenced data would be nice -- county + rurality codes. Record linking would be even better. Possibly revisit more traditional models and path analysis now that I have an exploratory sense of the data. Population stocks and flows driving Red versus Blue? Or perhaps the tension is due partly to cultural diffusion along stable population flows? This idea stems from my experience doing fieldwork in “Alexandria” Oregon, town that values its “country” identity. Here I met many people who migrate between small towns like Alexandria throughout Oregon and the US, moving yet avoiding the cosmopolitan centers over their life course. If there are such laminar strata of circulation, these populations may lead to identity stances, as well as cultural inertia due to domestic cultural reproduction. Thus, Red Versus Blue may, to some degree, be driven by population dynamics. But this idea needs to be investigated more rigorously. References Lakoff Elder corn stupid thing Fischer Hout TraMineR Cluster people Acknowledgements Prof. Jenna Johnson-Hanks, Dr. Sheila Martin, UC Berkeley Dean’s Normative Time Fellowship, and