Download

1 / 31
310 likes | 454 Views
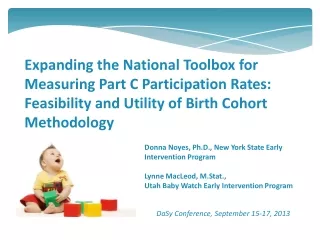
Expanding the National Toolbox for Measuring Part C Participation Rates: Feasibility and Utility of Birth Cohort Methodology. Donna Noyes, Ph.D., New York State Early Intervention Program Lynne MacLeod, M.Stat., Utah Baby Watch Early Intervention Program. DaSy Conference, September 15-17, 2013.

E N D
Expanding the National Toolbox for Measuring Part C Participation Rates: Feasibility and Utility of Birth Cohort Methodology Donna Noyes, Ph.D., New York State Early Intervention Program Lynne MacLeod, M.Stat., Utah Baby Watch Early Intervention Program DaSy Conference, September 15-17, 2013
http://www.ideainfanttoddler.org IDEA Infant and Toddler Coordinators Association (ITCA) The IDEA ITCA is a not-for-profit corporation that promotes mutual assistance, cooperation, and the exchange of information and ideas in the administration of Part C and provides support to state and territory Part C coordinators.
Need for Accurate and Reliable Measures of Part C Participation Required for 618 reporting Evaluate child find activities and identify improvement strategies Establish incidence and prevalence of developmental delays and medical conditions, if untreated, likely to result in developmental delays Project ongoing and future need for early intervention services Guide resource allocation and infrastructure planning and budgeting Establish valid cost data Determine future funding needs
General Estimates of Developmental Disabilities Among U.S. Children • Boyle et al. (2004) identified 16.8% of U.S. children ages 0-17 as having ever experienced a developmental disability, as reported by parents in the 1988 National Health Interview Survey (NHIS) • From 1997 to 2008, the NHIS prevalence rate of parent-reported developmental disabilities among U.S. children ages 3-17 increased from 12.4% to 15.02% (Boyle et al., 2011) • Developmental disabilities were reported in approximately 1 in 6 children in the U.S. between 2006 and 2008 • Prevalence of select disabilities (e.g., autism, attention deficit hyperactivity disorder) increased dramatically
Estimates of Developmental Delaysin U.S. Infants and Toddlers • Two key studies by Rosenberg and colleagues (2008, 2012) were directly relevant to the Part C field • Analyzed data collected from the Early Childhood Longitudinal Study-Birth Cohort (ECLS-B) • Sample: nationally representative sample of U.S. children born in 2001 (birth cohort) • Data: direct assessment of the study sample at 9 and 24 months of age (in 2001-2002 and 2003-2004, respectively)
Developmental Delays and Participation in Early Intervention Services for Young Children (Rosenberg et al., 2008) • Objectives: • Estimate rates of eligibility for Part C and access to developmental services (including early intervention); identify factors associated with service access • Findings: • Approximately 13% of children at 9 and at 24 months of age had developmental delays likely to make them eligible for Part C • Approximately 10% of 24-month-old children who met eligibility criteria for Part C were actually receiving services (any) to address developmental delays • Conclusions: • Prevalence of developmental delays higher than thought • Majority of children eligible for Part C not receiving services for delays • Limitations: • Only two domains assessed (cognitive and motor skills) • Parent report of service use may not agree with independent review • Receipt of any service for development delay, not just early intervention
Part C Early Intervention for Infants and Toddlers: Percentage Eligible Versus Served (Rosenberg et al., 2012) • Objective: • Compare theoretical eligibility to actual Part C participation • Methods: • Computed proportion of children in the ECLS-B 2001 birth cohort data who would be eligible for Part C based on every state’s numerical eligibility definition (per states’ websites in May 2012) • Compared these theoretical estimates of child developmental delays to states’ 2010 percentages served using point-in-time child counts • Findings: • Proportion of children likely to eligible for Part C ranged from 2% to 78% compared to enrollment rates of 1.48% to 6.96% • Conclusions: • Most states’ current eligibility definitions make many more children eligible than are served • 618 reporting may significantly underestimate participation in and the need for Part C
Impetus for Examination of Birth Cohort Methodology to Measure Part C Participation • Reaction from the Part C field to Rosenberg’s research was that estimates of children needing early intervention services were too high • In 2011, the ITCA Data Committee began compiling 2007 birth cohort data from a number of states in order to investigate the viability of using birth cohort methodology as an additional measure Part C participation • Collection of 2007 and 2008 data is complete, 2009 is underway
Current Methods of Measuring Part C Participation Rates • Current methodology for reporting participation rates under Part C of IDEA is established by federal regulations • Only required method is a “point-in-time” child count, defined as the number of infants and toddlers with an active Individualized Family Service Plan (IFSP) on a single state-designated day between October 1 and December 1 • States may optionally report “cumulative” child count, defined as the number of infants and toddlers with an IFSP in a given annual period, either calendar or fiscal year
2007 October 1 December 1 1/1/07 12/31/07 Point-in-Time Count Definition:Unduplicated number of infants and toddlers enrolled with an active IFSP on a single state-designated day between October 1 and December 1 Percentage Served Calculation:Point-in-time count (numerator) divided by birth through age 2 population from Census for year in which count was taken (denominator) multiplied by 100% Point-in-Time Count Methodology
Cumulative Count Methodology 2007 All children enrolled in early intervention during a given annual time period 1/1/07 12/31/07 Cumulative Count Definition:Unduplicated number of infants and toddlersenrolled with an active IFSP during a given annual period Percentage Served Calculation:Cumulative count (numerator) divided by birth through age 2 population from Census for given year(denominator) multiplied by 100%
Using Point-in-Time and Cumulative Counts to Measure Part C Participation • The Data Accountability Center (Bitterman & Markowitz, 2012) compared 618 data for the 30 states that reported both point-in-time and cumulative child counts in 2010 • For all 30 states, cumulative counts and percentages served exceeded point-in-time counts and percentages
Source: U.S. Department of Education, Office of Special Education Programs, Data Analysis System (DANS), OMB #1820-0557: "Infants and Toddlers Receiving Early Intervention Services in Accordance with Part C,” data updated as of July 15, 2011. 2010 Point-in-Time and Cumulative Child Counts, By State (N=30)
2010 Point-in-Time and Cumulative Percentages Served, By State (N=30) Source: U.S. Department of Education, Office of Special Education Programs, Data Analysis System (DANS), OMB #1820-0557: "Infants and Toddlers Receiving Early Intervention Services in Accordance with Part C,” data updated as of July 15, 2011. Note: Percentage = Child count (cumulative or point-in-time) birth through age 2 divided by population birth through age 2, multiplied by 100 Source: U.S. Department of Education, Office of Special Education Programs, Data Analysis System (DANS), OMB #1820-0557: "Infants and Toddlers Receiving Early Intervention Services in Accordance with Part C,” data updated as of July 15, 2011. Note: Percentage = Child count (cumulative or point-in-time) birth through age 2 divided by population birth through age 2, multiplied by 100 Source: U.S. Department of Education, Office of Special Education Programs, Data Analysis System (DANS), OMB #1820-0557: "Infants and Toddlers Receiving Early Intervention Services in Accordance with Part C,” data updated as of July 15, 2011. Note: Percentage = Child count (cumulative or point-in-time) birth through age 2 divided by population birth through age 2, multiplied by 100
2010 Mean Percentage Served Using Point-in-Time and Cumulative Child Counts Source: U.S. Department of Education, Office of Special Education Programs, Data Analysis System (DANS), OMB #1820-0557: "Infants and Toddlers Receiving Early Intervention Services in Accordance with Part C,” data updated as of July 15, 2011. Note: Percentage = Child count (cumulative or point-in-time) birth through age 2 divided by population birth through age 2, multiplied by 100.
What is Cohort Analysis? • A cohort is a group of people who have a common initial demographic characteristic, e.g., birth year or entry into school • A cohort study follows the same group of people over time and classifies them according to the development or non development of an outcome variable of interest • Method of establishing population-based prevalence and incidence of variable of interest • Does take time to collect data
Applying Cohort Analysis to Part C Participation • In terms of how cohort analysis could be applied to Part C participation: • The common demographic characteristic of identifying the cohort would be year of birth • The entry point and follow-up period for each birth cohort are well delineated, i.e., from birth through age two • For any birth cohort, there would be multiple outcome variables of interest for participation in any aspect of early intervention, i.e., referral, evaluation and eligibility determination, enrollment, and/or exit status
Birth Cohort Methodology 2007 2008 2009 2010 Birth Year 1/1/07 12/31/07 COHORT Potentially eligible for early intervention from birth through age 2 12/31/10 1/1/07 Birth Cohort:Number of infants and toddlers born in a specific year who were referred, evaluated, and/or enrolled anytime from birth through age 2 Percentage Served Calculation:Count of infants and toddlers born in a specific year who were referred, evaluated, and/or enrolled anytime from birth through age 2 (numerator) divided by resident births in that year (denominator) multiplied by 100%
Comparison of Three Methodologies 2007 2008 2009 2010 10/1/07 12/1/07 Point-in-Time 1/1/07 12/31/07 Birth Year Potentially eligible for early intervention from birth through age 2 1/1/07 12/31/07 Cumulative Birth Cohort COHORT 1/1/07 12/31/10
New York State Case Study MCGBG Department of Health and School of Public Health Internship Program Use New York State (NYS) local program data as a case study to compare impact of these methodologies on assessing program participation
Viability of Using a Birth Cohort Approach to Measuring Part C Participation • Using a birth cohort approach to measure Part C participation would . . . • Fit with current national interest in and efforts to build statewide longitudinal data systems that facilitate following children through Part C to pre-K and beyond • Inform the discussion to establish prevalence rates of developmental delay
Conclusions A • Point-in-time counts reported to OSEP by states underestimates child and family participation in early intervention programs nationally • Birth cohort analyses are a better benchmark to use in assessing the extent to which Part C programs are reaching eligible populations • Useful tool for states’ use in examining local program participation • More work is needed to understand the “baseline” of eligible infants and toddlers and how program participation is affected by state eligibility criteria
ITCA Interns Kendra Babitz, Masters in Public Policy, University of Utah (2013) The ITCA Data Committee would like to thank the two interns who assisted with this project: Raquel Valezquez, in partial fulfillment of Masters in Epidemiology degree, School of Public Health, University at Albany
Contacts Maureen Greer IDEA ITCA, Emerald Consulting ideaitca@aol.com Pam S. Roush Director, West Virginia Birth to Three Pam.S.Roush@wv.gov Donna M. Noyes, Ph.D. Co-Director, Bureau of Early Intervention, New York State Department of Health dmn02@health.state.ny.us Lynne M. MacLeod, M.Stat. Data Manager, Baby Watch Early Intervention Program, Utah Department of Health lmacleod@utah.gov