Download
1 / 32
330 likes | 467 Views
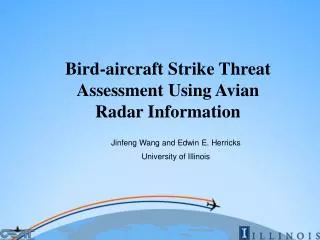
Bird-aircraft Strike Threat Assessment Using Avian Radar Information. Jinfeng Wang and Edwin E. Herricks University of Illinois. Background. Bird strike has been a major concern since the early days of aviation

E N D
Bird-aircraft Strike Threat Assessment Using Avian Radar Information Jinfeng Wang and Edwin E. Herricks University of Illinois
Background • Bird strike has been a major concern since the early days of aviation • Bird strike is a growing concern in the aerospace community. The number of reported bird strikes in the U.S. increased from 2000 in 1990 to about10,000 in 2009 • Huge cost
Objective • The objective of this work is to develop a bird strike threat assessment model to investigate bird strike hazards on, and around airports.
CEAT Radar Test Site • The threat assessment was conducted at Naval Air Station Whidbey Island (NASWI), Oak Harbor, Washington. • Runways, 7/25 and 14/32 form an "X" pattern • Analysis areas defined by radar coverage and aircraft flight paths Radar location
Data Collection • Radar data • Bird activity data is collected using Avian Radar System (25 kW, X-band marine radar operating at 9.4 GHz with a wavelength of 3 cm). • Data from the radar processor provided detection time, track ID, ground speed, heading direction, latitude and longitude. The processor also assembled tracks from target plots. • Data from 09/01/2008 to 09/28/2008 were used in this threat assessment. • Visual observation • Bird observations were made from 09/26/2008 to 09/28/2008 during which visual observed bird targets were related to radar detections.
Methodology • Data pre-processing • Extract bird activity data from radar data • Bird strike threat assessment • Target area determination • Parameter determination • Assessment
Data Pre-processing • Avian radar systems incorporate sophisticated detection and tracking algorithms to identify targets and track those targets in space and time. • Additional processing is needed to refine detection information and emphasize bird targets.
Data Pre-processing • Elimination of Non-bird detections • Vehicle and aircraft • Insects • Wave action and precipitation related detections
Data Pre-processing • Elimination of Non-bird detections • Vehicle and aircraft • Insects • Wave action and precipitation related detections
Data Pre-processing Vehicle or aircraft targets (Oct.28, 2008)
Data Pre-processing Before After Data: Track distribution in Sep. 27, NAS
Data Pre-processing • Elimination of Non-bird detections • Vehicle and aircraft • Insects • Wave action and precipitation related detections
Data Pre-processing • Insect elimination • Use airspeed standard • Studies showed that the airspeeds of insects are commonly lower than 6 m/s (Bruderer B, 2001; Feng H, 2004, Gauthreaux SA. 2008) • Assume if the airspeed of a detected target is lower than 6 m/s, the target is considered as an insect.
Data Pre-processing • Airspeed correction (Law of Cosine) = airspeed = target groundspeed (as determined from the radar track) = wind speed is the difference between the observed flight direction and the direction of the wind vector
Data Pre-processing • Elimination of Non-bird detections • Vehicle and aircraft • Insects • Wave action and precipitation related detections
Data pre-process Track density: Red: 7.5E03/hour Blue: 363.2/hour Green: 22/hour
Data Pre-processing • Non-bird target elimination • Vehicle and aircraft • Insects • Wave action and precipitation related detections
Methodology • Data pre-processing • Extract bird activity data from radar data • Bird strike threat assessment • Target area determination • Parameter determination • Asssessment
Threat Assessment • Although birds fly in all areas on and around the airport, the primary threat to aircraft is in flight paths of the aircraft. • These flight paths are highly controlled.
Target Area Determination Total Length Climb Approach Taking off Landing Free zone Touch down
Target Area Determination Total Length Part I Part II Landing/Taking-off distance Altitude (1000/3000ft) Climb Approach Taking off Landing Free zone Touch down Beyond the Runway On the Runway • Critical zones: • Part 1 – airport surface • Taking off zone • Landing zone • Part 2 – approach and departure path
Target Area Determination Total Length Part I Part II Landing/Taking-off distance Altitude (1000/3000ft) Climb Approach Taking off Landing Free zone Touch down Beyond the Runway On the Runway Landing information for runway 14 (FAA information for airports, 2009)
Target Area Determination Four target areas A, B, C and D on runway 7 and 14.
Threat Assessment • Bird strike threat in target area is measured by threat density, which is defined as the summation of the strike threat caused by each bird within target area divided by the area of target area Subject to: = 1, 2, 3, … , n; = 1, 2, 3, 4;
Threat Assessment Parameters • Body mass • Airspeed equivalent group for birds
Threat Assessment Parameters • Bird Body Mass • Bird body mass of each airspeed equivalent group * based on information in The Birds of North America Online, Dunning,1993; Bruderer &Boldt , 2001; Spear & Ainley , 1997
Threat Assessment Parameters • Distance effect • Based on near miss analysis (Klope et al. 2009) we considered a bird strike occurs any time a bird enters within 50 m of an operational aircraft. • The parameter value of within this distance is set to at 1 for distances of > 50 m. Value decreases with increasing distance. Target area
4 1 1 4 2 3 2 3 2 3 3 2 4 1 1 4 Runway Orientation Aircraft Bird flight direction Threat Assessment Parameters • Flight speed (radar detection) • Relative bird flight speed to the aircraft • Flight direction effect Target area Target area
Results • Temporal Analysis • Averaged threat density and bird activity varied at dawn and dusk. • The changing pattern of both daily bird activity and threat density are similar. • Spatial Analysis • There are two trends
Results 3 3 3 3 2 2 2 2 1 1 1 1
Conclusion • The evaluation results provide temporal and spatial variations of both bird activity and bird strike threat density in Ault Field, NASWI. • Results can aid in the assessment of bird strike threat and help direct wildlife management decisions.
--The End-- Thank you for the attention! Questions?