Download
1 / 1
10 likes | 112 Views
Post-processing on HMM decision metrics Average the off-diagonal values in each row of the matrix of decision metrics for use as an estimated value of the confusion matrix diagonal.

E N D
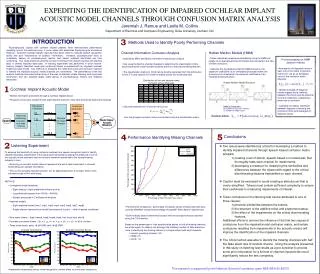
Post-processing on HMM decision metrics • Average the off-diagonal values in each row of the matrix of decision metrics for use as an estimated value of the confusion matrix diagonal. • Greater average off-diagonal values suggest more similarity between the stimuli and the potential incorrect responses, suggesting a lower rate of confusion. • Calculate correlation coefficient between diagonal of listening test confusion matrix and averaged off-diagonal values. Distribution of first and second vowel formants across channels Hidden Markov Model Structure EXPEDITING THE IDENTIFICATION OF IMPAIRED COCHLEAR IMPLANT ACOUSTIC MODEL CHANNELS THROUGH CONFUSION MATRIX ANALYSIS Jeremiah J. Remus and Leslie M. Collins Department of Electrical and Computer Engineering, Duke University, Durham, NC 3 INTRODUCTION Methods Used to Identify Poorly Performing Channels Psychophysical studies with cochlear implant patients have demonstrated performance variability across the electrode array, in some cases with electrodes displaying quite anomalous behavior. Aberrant cochlear implant channels have been linked to reduced speech recognition ability and poor transmission of auditory information. However, psychophysical tests to completely assess all psychophysical metrics and detect impaired electrodes are time consuming. This study proposes using the confusion matrices from closed response set listening tests to identify impaired electrodes. A listening experiment was performed in which normal-hearing subjects identified vowel and consonant tokens processed with an impaired cochlear implant acoustic model. Two methods of analyzing the vowel and consonant confusion matrices to identify the impaired acoustic model channels are considered. The performance of the two analysis methods motivates further study of the uses of relatively simple listening tests to provide information that can expedite larger scale testing of psychophysical metrics and impaired electrodes. Channel Information Confusion Analysis Hidden Markov Models (HMM) • Token similarities measured quantitatively using the HMM will ideally mirror perceptual token similarities and correlate to the rate of token confusion. • Calculate the log likelihood that the HMM trained on the cepstrum coefficients of an unimpaired processed token will produce as an observation the cepstrum coefficients of an impaired processed token. • Inspired by Miller and Nicely information transmission analysis. • Use vowel formant-to-channel mapping to determine the classification matrix assuming that the vowel formant locations are the critical discriminating features. • The classification matrix for CICA can be directly calculated from the distribution of first (F1) and second (F2) vowel formants across the model channels. • Calculate transmission in bits per stimulus as • from the grouped confusion matrix constructed using the classification matrix. 1 Cochlear Implant Acoustic Model • Mimics information presented through a cochlear implant device • Produces an acoustic waveform with eight discrete channels, each with discretized temporal envelopes Model (λ) Parameters M: number of Gaussian mixtures Q: number of model states Decision metric: 5 4 Conclusions Performance Identifying Missing Channels 2 Listening Experiment • Two issues were identified as critical for developing a method to identify impaired channels through speech-based confusion matrix analysis: • creating a set of stimuli, speech-based or nonsensical, that thoroughly tests each channel for impairments. • developing a measure for classifying the similarities and differences between the tokens with regard to the critical discriminating features transmitted on each channel. • Caution must be exercised to avoid creating a stimulus set that is overly simplified. Tokens must contain sufficient complexity to ensure their usefulness in measuring impairments of interest. • Token confusions in the listening test can be attributed to one of three causes: • phonetic similarities between the tokens; • the structure of the additive noise and experiment setup; • the effect of the impairments on the critical discriminating features. • Additional efforts to remove the influence of the first two causes of confusions from the impaired model confusion matrix, and isolate confusions resulting from impairments to the acoustic model, will improve the identification of the impaired channels. • The CICA method was able to identify the missing channels with half the false alarm rate of random chance. Using the analysis presented in this study on listening test results as a pre-screener to provide some prior information for a full test of channel impairments could significantly reduce the test complexity. • To examine the feasibility of using confusion matrices from speech recognition tests to identify impaired channels, impairments in this study were simulated by setting the amplitude of one of the acoustic model channels from the acoustic waveform presented to the normal-hearing subjects to zero. • Removing an acoustic model channel represents the worst-case impairment: a channel transmitting zero speech information. • This is not a clinically relevant scenario, but an appropriate proof of concept, which is the intended scope of this initial study. • METHOD • Unimpaired model (baseline) • Eight analysis / eight presentation filters (p-of-p) • Logarithmically spaced from 150Hz – 6450Hz • Speech processed in 2 millisecond windows • Impaired models • Eight impaired models [imp1, imp2, imp3, imp4, imp5, imp6, imp7, imp8] • Single channel removed from model (envelope set to zero) – other channels unaffected • Nine vowel tokens – [had, hawed, head, heard, heed, hid, hood, hud, who’d] • Fourteen consonant tokens – [b, d, f, g, j, k, m, n, p, s, sh, t, v, z] – in /aCa/ context • Three noise levels: quiet, +8 dB SNR, and +6 dB SNR • Impairment measurably affects vowel recognition, smaller effect on consonant recognition • Performance comparison: percentage of subjects whose missing channels were correctly identified versus the percentage of possible “false alarms” experienced. • Both methods perform better than chance with the best performance obtained using the CICA method. • Based on the percentage of total possible false alarms to find all missing channels, we would expect to observe (on average) the following number of false alarms en route to identifying the missing channel in a single subject with eight channels: • random guessing (chance): 3.5 • HMM: 2.5 • CICA: 1.6 This research is supported by the National Science Foundation grant NSF-BES-00-85370