Download
1 / 4
40 likes | 63 Views
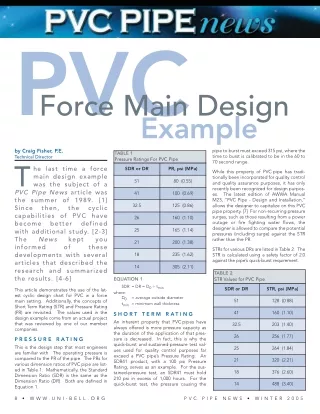
The last time a force main design example was the subject of a PVC Pipe News article wasthe summer of 1989. [1] Since then, the cyclic capabilities of PVC have become better defined with additional study.

E N D
PVC Force Main Design Example by Craig Fisher, P.E. Technical Director T PVC Pipe News article was the summer of 1989. [1] Since then, capabilities of PVC have become better with additional study. [2-3] The News informed developments with several articles that described the research and summarized the results. [4-6] pipe to burst must exceed 315 psi, where the time to burst is calibrated to be in the 60 to 70 second range. TABLE 1 Pressure Ratings For PVC Pipe he last time a force main design example was the subject of a SDR or DR PR, psi (MPa) While this property of PVC pipe has tradi- tionally been incorporated for quality control and quality assurance purposes, it has only recently been recognized for design purpos- es. The latest edition of AWWA Manual M23, “PVC Pipe - Design and Installation,” allows the designer to capitalize on this PVC pipe property. [7] For non-recurring pressure surges, such as those resulting from a power outage or fire fighting water flows, the designer is allowed to compare the potential pressures (including surge) against the STR rather than the PR. 51 80 (0.55) 41 100 (0.69) 32.5 125 (0.86) the cyclic 26 160 (1.10) defined 25 165 (1.14) kept of you 21 200 (1.38) these STRs for various DRs are listed in Table 2. The STR is calculated using a safety factor of 2.0 against the pipe’s quick-burst requirement. 18 235 (1.62) 14 305 (2.11) TABLE 2 STR Values for PVC Pipe EQUATION 1 SDR = DR = D0÷ tmin where: D0 = average outside diameter tmin= minimum wall thickness SDR or DR STR, psi (MPa) This article demonstrates the use of the lat- est cyclic design chart for PVC in a force main setting. Additionally, the concepts of Short Term Rating (STR) and Pressure Rating (PR) are revisited. The values used in the design example come from an actual project that was reviewed by one of our member companies. 51 128 (0.88) 41 160 (1.10) S H O R T T E R M R A T I N G An inherent property that PVC pipes have always offered is more pressure capacity as the duration of the application of that pres- sure is decreased. In fact, this is why the quick-burst and sustained-pressure test val- ues used for quality control purposes far exceed a PVC pipe’s Pressure Rating. An SDR41 product, with a 100 psi Pressure Rating, serves as an example. For the sus- tained-pressure test, an SDR41 must hold 210 psi in excess of 1,000 hours. For the quick-burst test, the pressure causing the 32.5 203 (1.40) 26 256 (1.77) P R E S S U R E R A T I N G This is the design step that most engineers are familiar with. The operating pressure is compared to the PR of the pipe. The PRs for various dimension ratios of PVC pipe are list- ed in Table 1. Mathematically, the Standard Dimension Ratio (SDR) is the same as the Dimension Ratio (DR). Both are defined in Equation 1. 25 264 (1.84) 21 320 (2.21) 18 376 (2.60) 14 488 (3.40) 8 • W W W . U N I - B E L L . O R G P V C P I P E N E W S • W I N T E R 2 0 0 5
C Y C L I C C A P A C I T Y The new research on the cyclic capabilities of PVC pressure pipe [2-3] confirmed that pre- dicting the fatigue capabilities of PVC is much like that of any other material. It is a function of two variables: the average stress and the stress amplitude. The design chart developed by the research is shown in Figure 1. Stress Amplitude (psi) 1000 3000 2000 1500 700 500 300 200 150 100 50 20 3000 Vinson USU 2500 Mean Stress (psi) Positive/Negative Line 2000 D E S I G N S T E P S Having reintroduced all the concepts, let’s review the design checks for our force main design example. There are three of them. First, normal operating pressures (including routine surges) are compared against the PR. The PR must meet or exceed the cyclic pressures routinely generat- ed during the force main’s operation. Second, non-cyclic peak pressures are compared against the STR. The STR must meet or exceed these occasional peak pressures generated by “infre- quent” surge. Finally, the cyclic capability of the PVC, as represented by the value C, must meet or exceed the number of cycles expected, C’, during the design life of the force main. 1500 Design Space 1000 2000 psi Limit 500 0 1.E+3 1.E+4 1.E+5 1.E+6 1.E+7 1.E+8 1.E+9 Number of Cycles Figure 1. Routine pressures the force main experi- ences are as follows: The water hammer resulting from an instanta- neous stoppage of flow serves as a conserva- tive estimate of the worst-case, non-recurring surge. It will be assumed this occurs while the pump is operating at its normal duty point. With that information, the worst-case peak pressure may be determined as follows: Pop= Operating Pressure = 27 psi (Known) D E S I G N R E Q U I R E M E N T S The pipe under consideration is a 14-inch, SDR 41, CSA B137.3 pipe, with an IPS diame- ter regimen. As this is similar to the 14-inch IPS option in AWWA C905-97, the C905 stan- dard will be referenced in this example. The design flow is 2.65 ft3/sec. It is estimated that the variable speed pump will have 24 starts and 24 stops each day. Once the steady-state- operating flow has been achieved, the operat- ing pressure is 27 psi. During start-up or shut- down, the pressure fluctuations for the vari- able speed pump may be as large as 10 psi. The force main discharges into a manhole at atmospheric pressure at the upstream end. Pamp= Maximum Pressure Fluctuation = 10 psi (Known) Ps’ = Surge response to a 1 ft/sec instantaneous change in velocity = 11.4 psi for SDR41(Table 5-6 AWWA M23 [7]) Pmax= Maximum Routine Pressure = Pop+ Pamp = 27 + 10 = 37 psi Ps= Worst-case surge = DvmaxPs’ = (2.78) (11.4) = 31.7 psi Pmin= Minimum Routine Pressure = Pop- Pamp = 27 - 10 = 17 psi Ppeak= Peak pressure from unusual event = Pop+ Ps = 27.0 + 31.7 = 58.7 psi Hoop stresses from routine pressures may now be calculated. See pages 53 to 58 of AWWA M23 [7] for details: From the AWWA C905 standard, the following dimensions may be looked-up or calculated: D0= Average Outside Diameter = 14.000 inches (Table 1 of C905) savg= Average Hoop Stress = (Pop÷ 2) (SDR -1 ) = (27 ÷ 2) (41 - 1) = 540 psi Calculating the number of cycles endured by the force main over its design life is simple. tmin= Minimum Wall Thickness = 0.341 inches (Table 1 of C905) cycles/day = 24 starts + 24 stops = 48 cycles/day (Known) samp= Stress Amplitude = (Pamp÷ 2) (SDR -1 ) = (10 ÷ 2) (41 - 1) = 200 psi tmintol = Tolerance on the Minimum Wall = +0.048 inches (Table 1 of C905) cycles/year = (cycles/days) (365 days/year) = (48) (365) = 17,520 cycles/year Di= Inside Diameter = D0- 2tmin- tmintol = 14.000 - 2(0.341) - 0.048 = 13.270 inches The fluid velocity while operating at the duty point is as follows: Design Life = 100 years (Known) C’ = Anticipated number of cycles during force main’s design life = (cycles/year) (design life) = (17,520) (100) = 1.752 x 10⁶ Q = 2.65 ft3/sec (Known) Ax= Cross Sectional Area = (p ÷ 4) (Di)2 = (3.14 ÷ 4) (13.270)2 = 138 in2 = 0.960 ft2 v = Fluid Velocity = Q ÷ A = 2.65 ft3/sec ÷ 0.960 ft2 = 2.78 ft/sec P V C P I P E N E W S • W I N T E R 2 0 0 5 W W W . U N I - B E L L . O R G • 9
In this example, the first independent vari- able, savg, has a value of 540 psi. In Figure 2, that value is shown in green on the y-axis. A green line extends right from that value until it intersects the second independent vari- able, samp. In the example, samphas a value of 200 psi. At the intersection of the green line and the black line for the 200 psi stress amplitude, the tail of a blue line is shown. The blue line is extended downward until it hits the x-axis. The value for C in this exam- ple is 4.2 x 10⁷, which is read from the x-axis of the chart at the point of intersection of the arrowhead of the blue line and the x-axis. Stress Amplitude (psi) 1000 3000 2000 1500 700 500 300 200 150 100 50 20 3000 Vinson USU 2500 Mean Stress (psi) Positive/Negative Line 2000 1500 Design Space 1000 2000 psi Limit 540 500 R E F L E C T E D P R E S S U R E W A V E S In this example, no secondary or tertiary pressure waves are generated during a pump start-up or shut-down because the system is vented to the atmosphere. If the system were a closed system, and if surge pressures were able to be reflected, addi- tional analysis using Miner’s Rule would be needed to determine the system’s cyclic life. Appendix A of Reference 3 discusses the theory as does Reference 6. 0 1.E+3 1.E+4 1.E+5 1.E+6 1.E+7 1.E+8 1.E+9 4.2E+7 Number of Cycles Figure 2. D E S I G N C H E C K S Is the operating pressure less than or equal to the PR of the SDR41 selected? design chart. Refer to Figure 2. First note that it is a semi-log chart. The x- axis has a logarithmic scale. One of the two independent variables, average stress, serves as the chart’s y-axis. The second independent variable, stress amplitude, is represented by the diago- nal black lines that overlay the chart. Each line represents a different stress amplitude. As one moves from left to right across the chart, the stress ampli- tudes represented by the black lines decrease. The x-axis is the dependent variable, and it denotes the cyclic life of the PVC pressure pipe. Pop≤ PR? 27 psi ≤ 100 psi (From Table 1) In this example, the cyclic life is recalculat- ed with the following assumptions: Yes. The first design check is passed. Is the peak pressure less than or equal to the STR of the SDR41 selected? • The system is closed and the surge pressure wave is reflected throughout the system. Ppeak≤ STR? 58.7 psi ≤ 160 psi (From Table 2) • The attenuation of the secondary and tertiary waves follows a dampened sinu- soidal pattern as shown in Figure 3. Yes. The second design check is passed. Is the cyclic capacity greater than the antic- ipated number of cycles expected for the force main over its design life? C’ ≤ C? 1.752 x 10⁶≤ 4.2 x 10⁷(From Figure 1) Yes. The third and last design check is passed. The design is satisfactory. What cyclic life would the force main have under these operating conditions? Cyclic Life = C ÷ Anticipated Number of Cycles per Year Cyclic Life = 4.2 x 10⁷÷17,520 cycles/year Cyclic Life = 2,397 years C Y C L I C C H E C K The manner by which the 4.2 x 10⁷value for C was determined is further detailed for those not familiar with the cyclic Figure 3. Typical surge pattern, where the pressures decay in a dampened sinusoidal pattern. 1 0 • W W W . U N I - B E L L . O R G P V C P I P E N E W S • W I N T E R 2 0 0 5
The first step is to represent the pressure pattern with the equivalent number of primary pressure waves. References 3 and 6 show that the secondary and tertiary waves have the fatigue equivalent of 0.55 primary waves. So, the number of cycles per year must be increased by 55% to account for the pressure pattern generated by reflected surge pressure waves. The How-To Handbook of PVC Pipe 522 PAGES Primary Cycles per Year = (1.55) (17,520) Primary Cycles per Year = 27,156 cycles/year Cyclic Life = C ÷ Anticipated Number of Primary Cycles per Year Cyclic Life = 4.2 x 10⁷÷ 27,156 cycles/year Cyclic Life = 1,547 years The design is again shown to be more than satisfactory from a cyclic fatigue point-of-view. C L O S I N G The real engineering work was done before our member was contacted to review this design. A pipe diameter and pump had already been selected. Presumably, the combination was the one most efficient for the flow desired and the align- ment’s topography. For that combination, operating pres- sures and pressure fluctuations were provided. The only complete reference for those who plan, design, install and operate PVC systems for municipal water mains, sanitary sewer and storm water drainage systems. If you are planning, or now operate a PVC pressure or non-pressure sys- tem, this handbook is a must! Admittedly, this is a straightforward design example. No iter- ation was required. The PR, STR, and cyclic capability provid- ed were more than adequate. When realistic design values are used, the results shown here are typical. The PVC prod- uct that the utility routinely uses is normally very robust for the demands of the specific application. Indicate preferred format: ❑ Hard-Bound $48/each (Includes postage and handling for US and Canadian orders.) ❑ CD-ROM $20/each References: Payable in US Funds, Texas Residents add 8.25 percent sales tax. 1. Bauer, Dennis E., “PVC Force Main Design is Key to Long-Term Performance,” Uni-Bell PVC Pipe News, Summer, 1989, Dallas, Texas, pp. 10+. Plus air mail charges: ❑ All Other Countries $28/bk ❑ Mexico $16/bk 2. Moser, Alma P., “Cyclic Life of PVC Pipe,” Utah State University, College of Engineering, Logan, Utah, February 17, 2001. Mail coupon with your check to: Uni-Bell PVC Pipe Association 2655 Villa Creek Drive, Suite 155 Dallas, Texas 75234 3. Jared D. Jeffrey et al, “Long-Term Cyclic Testing of PVC Pipe,” Utah State University, College of Engineering, Logan, Utah, February 26, 2004. 4. Dorsett, Matt, “New Tests and Analysis Serve to Improve Cyclic Design,” PVC News, Spring 2001, Dallas, Texas, pp. 1+. PC Requirements for Electronic Version: 5. Fisher, Craig, “PVC Pressure Pipe Endures Over Ten Million Cycles,” PVC Pipe News, Spring 2004, Dallas, Texas, pp. 9+. • I386, I486, Pentium or Pentium Pro processor-based personal com- puter • Microsoft Windows 95 or Windows NT 3.51 or later • 8 MB of RAM (16 MB for Windows NT) available to Acrobat Reader • 10 MB of available hard disk space • CD-ROM drive 6. Fisher, Craig, “The Anatomy of a Force Main Pressure Wave,” PVC Pipe News, Summer 2004, Dallas, Texas, pp. 6-8. 7. “Manual M23: PVC Pipe - Design and Installation,” American Water Works Association, Denver, Colorado, 2002. Name ____________________________________________________ Company __________________________________________________ Address __________________________________________________ City ______________________________________________________ State/Province ______________________________________________ Zip/Postal Code ____________________________________________ Country____________________________________________________ Phone: ____________________________________________________ Fax: ______________________________________________________ E-mail: ____________________________________________________ 8. “AWWA Standard for Polyvinyl Chloride (PVC) Pressure Pipe and Fabricated Fittings, 14 in. Through 48 in. (350 mm through 1,200 mm) ANSI/AWWA C905,” American Water Works Association, Denver, CO, 1997. 9. “CSA Standard B137.3, Rigid Polyvinyl Chloride (PVC) Pipe for Pressure Applications,” Canadian Standards Association, Etobicoke, Ontario. P V C P I P E N E W S • W I N T E R 2 0 0 5 W W W . U N I - B E L L . O R G • 1 1