
Analysis of Dust Events and Weather Conditions in the Wasatch Front Region
This document presents a detailed analysis of dust events and their impacts on weather conditions in the Wasatch Front and Intermountain West regions. Utilizing true color imagery from NASA's Blue Marble, we explore the geographic features, snowpack conditions, and the frequency of dust events recorded at the Salt Lake City International Airport (KSLC). The report includes statistics on dust flux, visibility, and meteorological conditions during significant dust events from 2001 to 2010. Comprehensive figures and data visualizations support the analysis, showcasing the relationship between dust phenomena and weather patterns.

Analysis of Dust Events and Weather Conditions in the Wasatch Front Region
E N D
Presentation Transcript
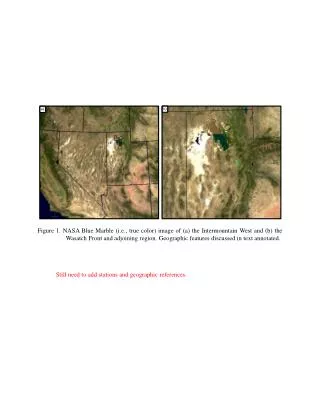
b) a) Figure 1. NASA Blue Marble (i.e., true color) image of (a) the Intermountain West and (b) the Wasatch Front and adjoining region. Geographic features discussed in text annotated. Still need to add stations and geographic references.
a) Ben Lomond Peak 26 Apr 2005 b) Alta 30 Apr 2000 Figure 2. Examples of Wasatch Mountain snowpacks (a) without dust loading (Ben Lomond Peak, 26 Apr 2005) and (b) with dust loading from episodic dust events (Alta, UT, 30 Apr 2009).
Figure 5. Estimated cumulative dust flux during KSLC dust events by water year.
Figure 7. Estimated mean cumulative dust flux during KSLC dust events by month.
Figure 8. Number of observations at KSLC with a wind speed > 10 m s-1 by month. Comment: Is this normalized? Specials skew this slightly.. We may need to discuss and revise, although I don’t expect results to change that much.
Figure 9. Number of dust reports at KSLC by time of day (MST).
Figure 10. Number of observations at KSLC with a wind speed > 10 m s-1 by time of day (MST)
Figure 12. Fraction (%) of estimated cumulative dust flux as a function of wind direction at KSLC.
Figure 13. Number of recent (2001–2010) dust events at KSLC by month.
Reflectivity (DbZ) 10 20 30 40 50 60 Elevation (m) 1350 1700 2050 2400 KSLC b) NARR 700hPa: 1700 MST 19 May 2006 a) KMTX: 1600 MST 19 May 2006 Figure 14. Weather conditions during the 19 May 2006 dust event. (a) 1600 MST KMTX 0.5º radar reflectivity (dBZ following scale at upper right) and topography (color filled at X m intervals). (b) 1700 MST NARR 700-hPa temperature (shaded following scale at bottom) and wind (full and half barb denote 2.5 and 5 m s-1, respectively). Always need to use scales. Add one for reflectivity at left. Suggest higher wind density at right and using contours rather than b/w fill. Bummer that we have to mix b/w and color. What is time of the NARR analysis? Can’t be 1600 MST.
Figure 15. Number of dust reports relative to frontal passage during recent (2001–2010) dust events with a mobile or baroclinic trough passage from the west or northwest at KSLC.
Need to work on this. Suggest converting from eps to tiff before importing. Figure 16. Weather conditions during the 10 May 2004 dust event. (a) XXXX MST GOES visible satellite imagery with dust identified in red. (b) XXXX MST NARR 850-hPa geopotential height. (c) XXXX MST NARR 700-hPa temperature (shaded following scale at bottom) and wind (full and half barb denote 2.5 and 5 m s-1, respectively).
Figure 17. Frequency of NARR (a) 700-mb wind speed, (b) 700-hPa wind direction, and (c) boundary layer depth at KSLC at the time of initial dust report during the cold front and baroclinic trough passage events from the west and northwest (solid) and in a 21-day weighted climatology centered on the event dates. Will need to discuss this and updated it for 21-day running mean. May need to do maximum boundary layer depth instead of depth at time of observation.
Figure 18. Dust plume origins and orientations associated with dust reports from observing stations and observer notes as identified following the color scale at upper left. Jeff-given our emphasis on the Wasatch Front, I wonder if we should color fill this as follows: KSLC only KSLC and other stations and/or notes Notes only Delta only Elko only Pocatello only Multiple stations/notes, but no KSLC Pick color scales so that the sites in Utah are fairly close.
Figure 19. HYSPLIT 6 h backtrajectoriesfrom 1000-m above ground level for all KSLC dust events since 2004. Regenerate without lakes if possible.