Download
1 / 44
440 likes | 546 Views
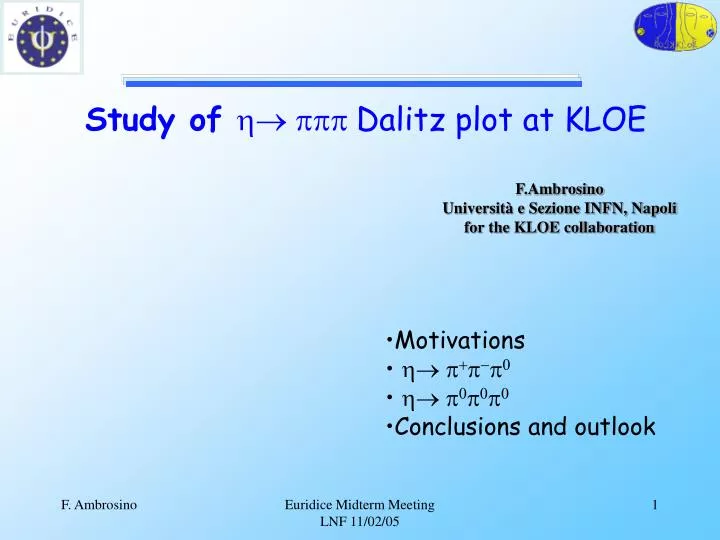
Study of h ppp Dalitz plot at KLOE. F.Ambrosino Università e Sezione INFN, Napoli for the KLOE collaboration. Motivations h p + p - p 0 h p 0 p 0 p 0 Conclusions and outlook. h 3p in chiral theory. The decay h 3 p occours primarily on account of the d-u

E N D
Study of h ppp Dalitz plot at KLOE F.Ambrosino Università e Sezione INFN, Napoli for the KLOE collaboration • Motivations • h p+p-p0 • h p0p0p0 • Conclusions and outlook Euridice Midterm Meeting LNF 11/02/05
h3p in chiral theory The decay h 3 poccours primarily on account of the d-u quark mass differences and the result arising from lowest order chiral pertubation theory is well known: And, at l.o. With: A good understanding of M(s,t,u) can in principle lead to a very accurate determination of Q: Euridice Midterm Meeting LNF 11/02/05
…and its open questions • Still there are some intriguing questions for this decay : • Why is it experimental width so large (270 eV) w.r.t theoretical calculation ? (Tree level: 66 eV (!!!); 1 loop : 160 eV ) Possible answers: • Final state interaction • Scalar intermediate states • Violation of Dashen theorem • Is the dynamics of the decay correctly described by theoretical calculations ? Euridice Midterm Meeting LNF 11/02/05
Dalitz plot expansion The usual expansion of square modulus of the decay amplitude about the center of the Dalitz plot is: |A(s,t,u)|2 = 1 + aY + bY2 + cX + dX2 + eXY Where: Euridice Midterm Meeting LNF 11/02/05
Dalitz expansion: theory vs experiment [1] Gasser,J. and Leutwyler, H., Nucl. Phys. B 250, 539 (1985) [2] Kambor, J., Wiesendanger, C. and Wyler, D., Nucl. Phys. B 465, 215 (1996) Tabella sperimentale di Bijnens Euridice Midterm Meeting LNF 11/02/05
h 3p at KLOE At KLOE h is produced in the process f hg . The final state for h p+p-p0is thus +-, and the final state for h p0p0p0 is 7g, both with almost no physical background. • Selection: • 2 track vertex+3 g candidates • Kinematic fit Euridice Midterm Meeting LNF 11/02/05
“core” sX = 0.018 Resolutions and efficiency “core” sY = 0.027 Efficiency almost flat, and 36% Euridice Midterm Meeting LNF 11/02/05
Comparison Data-MC:p+ Euridice Midterm Meeting LNF 11/02/05
Comparison Data-MC:p- Euridice Midterm Meeting LNF 11/02/05
Signal B/S 0.8% Euridice Midterm Meeting LNF 11/02/05
Fitting function • The analysis has been applied on 450 pb–1 corresponding to: • N(+-0) = 1,425,131 • events in the Dalitz plot, fitted with function: • fit is stable… • …but the model seems not to fit adeguately data (BAD Pc2). • We have added the cubic terms: |A(X,Y)|2 = 1+aY+bY2+cX+dX2+eXY |A(X,Y)|2 = 1+aY+bY2+cX+dX2+eXY+fY3+gX3+hX2Y+lXY2 Euridice Midterm Meeting LNF 11/02/05
Fit stability Euridice Midterm Meeting LNF 11/02/05
Results |A(X,Y)|2 = 1+aY+bY2+cX+dX2+eXY+fY3 Euridice Midterm Meeting LNF 11/02/05
Results (II) |A(X,Y)|2 = 1-1.072 Y+0.117 Y2+0.047 X2+0.13Y3 Using preliminary KLOE results shown at ICHEP 04 B.V. Martemyanov and V.S. Sopov (hep-ph\0502023) have extracted: Q = 22.8 ± 0.4 against Qdashen= 24.2 (as already argued for example in J. Bijnens and J. Prades, Nucl. Phys. B490, 239 (1997) Euridice Midterm Meeting LNF 11/02/05
h 3p0 : Dalitz plot expansion The dynamics of the h p0 p0 p0 decay can be studied analysing the Dalitz plot distribution. The Dalitz plot density ( |A|2 ) is specified by a single parameter: |A|2 1 +2z with: Z [ 0 , 1 ] Ei = Energy of the i-th pion in the rest frame. = Distance to the center of Dalitz plot. max = Maximun value of . Euridice Midterm Meeting LNF 11/02/05
Dalitz expansion: theory vs experiment [1] Gasser,J. and Leutwyler, H., Nucl. Phys. B 250, 539 (1985) [2] Kambor, J., Wiesendanger, C. and Wyler, D., Nucl. Phys. B 465, 215 (1996) Euridice Midterm Meeting LNF 11/02/05
Photons pairing Recoil is the most energetic cluster. In order to match every couple of photon to the right 0we build a 2-like variable for each of the 15 combinations: With: is the invariant mass of i0for j-th combination = 134.98 MeV is obtained as function of photon energies Euridice Midterm Meeting LNF 11/02/05
Pur 92 % Eff 14 % Pur 85 % Eff 22 % Pur 98 % Eff 4.5 % Combination selection • Cutting on: • Minimum 2 value • 2 between “best” and “second” combination • One can obtain samples with different purity-efficiency • Purity= Fraction of events with all photons correctly matched to p0 ‘s Euridice Midterm Meeting LNF 11/02/05
The problem of resolution MC reconstructed Phase space Resolution Efficiency Euridice Midterm Meeting LNF 11/02/05
Results on MC Euridice Midterm Meeting LNF 11/02/05
Results on MC Euridice Midterm Meeting LNF 11/02/05
Results on MC Euridice Midterm Meeting LNF 11/02/05
Comparison Data - MC The agreement is good on all spectra Euridice Midterm Meeting LNF 11/02/05
= -0.0ZZ 0.004 = -0.0XX 0.002 = -0.0YY 0.002 Fitting Data Low purity High purity Medium purity Systematics are at the same level of the statistical error Euridice Midterm Meeting LNF 11/02/05
Conclusions • KLOE is analyzing an unprecedented statistics of h3p decays with negligible background • For p+p-p0 channel the analysis is almost completed and finds evidence for an unexpected large y3 term • 3 p0 analysis is much harder, we expect to provide soon a result at the same level of the Crystal Ball one. Euridice Midterm Meeting LNF 11/02/05
SPARE SLIDES Euridice Midterm Meeting LNF 11/02/05
Kinematic fit with no mass constrains Euridice Midterm Meeting LNF 11/02/05
Tests of the fit procedure on MC Generator slopes in MC rad-04: a = -1.04 b = 0.14 c = 0. d = 0.06 e = 0. KLOE measure (100 pb-1) Euridice Midterm Meeting LNF 11/02/05
Comparison Data-MC data MC A.U. Euridice Midterm Meeting LNF 11/02/05
NA48: 547.843 0.030st 0.041sys Physica ScriptaT99 140-142, 2002 Shift 0.03 MeV Comparison Data-MC: Ych – Y0 Shift 1.33 MeV Euridice Midterm Meeting LNF 11/02/05
Fit procedure The fit is done using a binned 2 approach • i is for each bin: the efficiency as a function of Dalitz-plot. • Ni is for each bin: the number of events of Dalitz-plot. • i is the statistical error on the ratio Ni /i • All the bins are included in the fit apart from the bins crossed by the Dalitz plot contour. Euridice Midterm Meeting LNF 11/02/05
Comparison Data-MC: X & Y Euridice Midterm Meeting LNF 11/02/05
Goodness of fit Comparison between efficiency corrected data and fitted function as function of the bin number. The structure observed is due to the Y distribution for X slices P(2 02) 60% Euridice Midterm Meeting LNF 11/02/05
2 1 63876 64082 196264 196104 304930 304455 577741 577849 209043 209204 381585 381637 3 4 Asymmetries - + As = (0.07 0.09) 10-2 A = (-0.009 0.093) 10-2 Aq = (-0.02 0.09) 10-2 Euridice Midterm Meeting LNF 11/02/05
h p+p-p0(g) We have tested the effect of radiative corrections to the Dalitz plot density. The ratio of the two plots has been fitted with the usual expansion: corrections to parameters are compatible with zero Euridice Midterm Meeting LNF 11/02/05
h p+p-p0 : time stability To check stability wrt data taking conditions we fit the integrated Dalitz plot in samples of 4 pb-1 each Euridice Midterm Meeting LNF 11/02/05
eReal (X,Y) eReal (X,Y) 1+aY+bX2 |A(X,Y)|2 eMC(X,Y) eMC(X,Y) Check on cubic term Fitted function is actually : Assume: No cubic dependence in |A(X,Y)|2 |A(X,Y)|2 = 1 + aY + bY2 + dX2 with a -1. Can evaluate a such as to mimic the cubic term. Euridice Midterm Meeting LNF 11/02/05
MC MC weighted p+ MC MC weighted p- Euridice Midterm Meeting LNF 11/02/05
Sample selection • The cuts used to select: h p0 p0 p0 are : • 7 and only 7 prompt neutral clusters with 21° < < 159° • and E> 10 MeV • opening angle between each couple of photons > 18° • Kinematic Fit with no mass constraint • 320 MeV < Erad < 400 MeV • P(2) > 0.01 Euridice Midterm Meeting LNF 11/02/05
Euridice Midterm Meeting LNF 11/02/05
Second kinematic fit Once a combination has been selected, one can do a second kinematic fit imposing 0 mass for each couple of photons. Euridice Midterm Meeting LNF 11/02/05
Doing it the hard way.. Still we minimize: But now: ni = recostructed events i= fromeach single MC recostructed event weighted with the theoretical function Euridice Midterm Meeting LNF 11/02/05
Comparison Data – MC (II) The center of Dalitz plot correspond to 3 pions with the same energy (Ei = M/3 = 182.4 MeV). A good check of the MC performance in evaluating the energy resolution of 0 comes from the distribution of E0 - Ei for z = 0 Euridice Midterm Meeting LNF 11/02/05
Comparison Data – MC (II) E*g1 - E*g2 Vs. Ep Euridice Midterm Meeting LNF 11/02/05