Download
1 / 12
120 likes | 224 Views
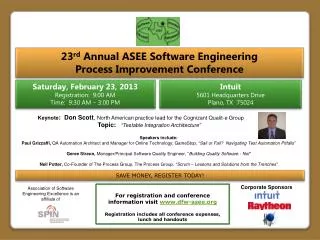
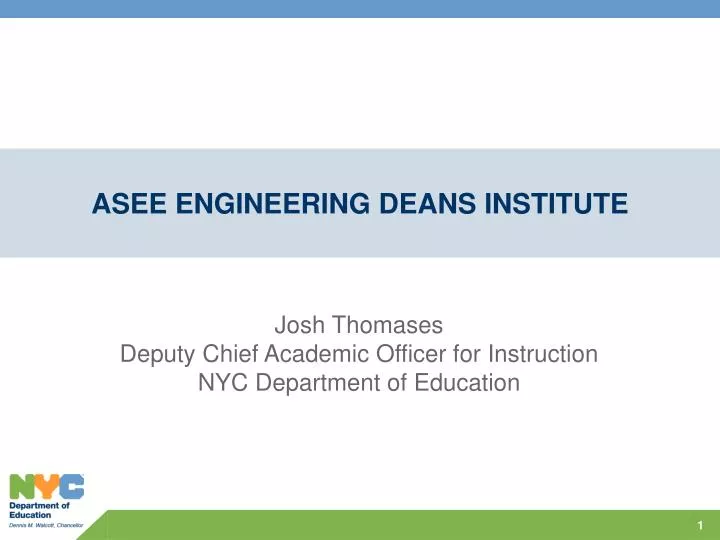
ASEE ENGINEERING DEANS INSTITUTE. Josh Thomases Deputy Chief Academic Officer for Instruction NYC Department of Education. 1. AFTER REMAINING NEARLY FLAT FOR 10 YEARS, NYC’S GRADUATION RATE HAS INCREASED BY 41 PERCENT SINCE 2005. 1992-2001: +0% (City Calculation). 2002-2011: +39%

E N D
ASEE ENGINEERING DEANS INSTITUTE Josh Thomases Deputy Chief Academic Officer for Instruction NYC Department of Education 1
AFTER REMAINING NEARLY FLAT FOR 10 YEARS, • NYC’S GRADUATION RATE HAS INCREASED BY 41 PERCENT SINCE 2005 1992-2001: +0% (City Calculation) 2002-2011: +39% (City Calculation) * 2005 to 2011: +40.9% (State Calculation) Class of NYC Calculation Method NY State Calculation Method Notes: NYC traditional calculation includes Local and Regents Diplomas, GEDs, Special Education diplomas, and August graduates. It does not include disabled students in self-contained classrooms or District 75 students. The NYS calculation, used since 2005, includes Local and Regents Diplomas and all disabled students. It does not include GEDs and Special Education diplomas. * Final year NYS did not include August graduates. 2
MORENEW YORK CITY STUDENTS ARE COLLEGE- READY THAN A DECADE AGO Graduation Rates % of Cohort Graduating in 4 years* College Readiness % of Students in Cohort Graduating College- Ready** AP Performance # of Students Passing at least 1 Exam*** CUNY Enrollment # of DOE Graduates**** Enrolling at CUNY as First-time Freshmen Increase 2005–11: +19 pts. Increase 2005–12: +10 pts. Increase 2002–12: +87% Increase 2002–11: +62% *August graduate data is only available for the classes of 2008–11. **According to the Progress Report College Readiness Index, which is defined as the percentage of students who met the 2012 CUNY standards for passing out of remedial coursework. According to the Progress Reports’ 2012 definition, 29% of students are College Ready when you include results on the ACT and the CAT. ***2002 data are from the College Board’s 2004 College Bound Seniors Report. College Board updates its historic data annually to adjust for revised data on students. Data reported are the most recent comprehensive information available to the NYCDOE; 2012 data are from the College Board's 2012 College Bound Seniors Report. ****Includes all students who, when they enroll in the fall, report to CUNY that they have graduated from a NYC high school at any point in time. Source: CUNY Office of Institutional Research and Assessment. 3
FOUR-YEAR GRADUATION RATES INCREASED FROM 2005-2011 ACROSS ETHNICITY GROUPS Asian Students Black Students Hispanic Students White Students 82.9 82.4 78.9 80.1 78.2 76.5 77.6 74.8 71.8 69.0 66.8 67.1 66.3 64.0 60.6 60.4 59.0 57.8 58.2 55.9 55.9 53.3 47.8 +25.0% 43.5 42.9 +23.3% 40.1 40.1 37.4 +50.6% +57.8% 05 06 07 08 09 10 11 05 06 07 08 09 10 11 05 06 07 08 09 10 11 05 06 07 08 09 10 11 Local Diploma Regents and Advanced Regents Note: Totals reflect data available at the time of reporting provided by NYS; August graduate data is only available for years 2008-2011 The overall rate may not equal the sum of each diploma type due to rounding. 4
RACE IS A PREDICTOR OF COLLEGE AND CAREER READINESS A college and career ready racial gap for males exists at all 8th grade ELA proficiency levels Percent of Males achieving College Readiness in 2010 after 4 Years of High School* Grade 8 ELA Proficiency Level (2006) *College Readiness as defined by APM “English/Math APM” (Aspirational Performance Measures) which includes students who scored 80 or higher on a Regents examination in mathematics and 75 or higher on the English Regents examination. Totals reflect data available at the time of reporting provided by NYSED; August graduate data available for 2010. **Students with no score are those who were not enrolled in the DOE in 8th grade. 5
RACE IS A PREDICTOR OF COLLEGE AND CAREER READINESS A college and career ready racial gap for males exists at all 8th grade Math proficiency levels Percent of Males achieving College Readiness in 2010 after 4 Years of High School* Grade 8 Math Proficiency Level (2006) *College Readiness as defined by APM “English/Math APM” (Aspirational Performance Measures) which includes students who scored 80 or higher on a Regents examination in mathematics and 75 or higher on the English Regents examination. Totals reflect data available at the time of reporting provided by NYSED; August graduate data available for 2010. **Students with no score are those who were not enrolled in the DOE in 8th grade. 6
NO MATTER THE INDICATOR, BLACK AND LATINO YOUNG MEN ARE NOT READY FOR COLLEGE The number of male students achieving the English/Math Regents-based Aspirational Performance Measure Asian Male Students Black Male Students Hispanic Male Students White Male Students 44.8 35.4 10.3 8.7 05 06 07 08 09 10 05 06 07 08 09 10 05 06 07 08 09 10 05 06 07 08 09 10 NYS Percent of 4-Year Cohort achieving English/Math APM (Note: 2009 & 2010 includes August grads) Note: Totals reflect data available at the time of reporting provided by NYS; August graduate data is only available for years 2009-2010.
NEW YORK CITY IS FOCUSED ON STRENGTHENING STUDENT WORK AND TEACHER PRACTICE • New York State adopts Common Core standards • New York State passes Education Law 3012-c 2009-10 • New York City launches Common Core pilots in 100 schools • Teacher Effectiveness Pilot begins with 20 schools and over 700 teachers 2010-11 • All schools implement citywide instructional expectations 2011-12 • New York State assesses Common Core in grades 3-8 • DOE recommends Common Core-aligned curriculum materials • All schools implement citywide instructional expectations 2012-13 • New York State assesses Common Core in Algebra I, Geometry, ELA Regents • All schools implement citywide instructional expectations • Implementation of Education Law 3012-c citywide, pending agreement 2013-14 2014-15 • New York City students take State PARCC* assessments * New York is part of a consortium of states, the Partnership for the Assessment of Readiness for College and Careers (PARCC), working together to develop new state assessments. 8
CTE IS A KEY LEVER FOR COLLEGE AND CAREER READINESS IN NEW YORK CITY There are 38 designated Career and Technical Education high schools in New York City, serving approximately 26,000 students annually. CONFIDENTIAL DRAFT – for discussion only
CTE Positions Students for Postsecondary Success CONFIDENTIAL DRAFT – for discussion only Three components of CTE practice in NYC align to federal and local policy guidance, as articulated in the USDOE April 2012 CTE Blueprint for Reauthorization of the Carl D. Perkins Act (VTEA) and 2008 NYC Mayoral Task Force on CTE Innovation Report
New York city has opened 11 engineering-focused CTE programs The 11 programs listed represent State approved or under review for approval engineering programs . CONFIDENTIAL DRAFT – for discussion only
QUESTIONS 12