Download
1 / 20
200 likes | 351 Views
Polychronic Tendency Models: A Gender Contrast Study. by Jay D. Lindquist Western Michigan University and Carol F. Kaufman-Scarborough Rutgers University. Introduction. Polychronic and monochronic behavior (time use) Studies from the 1950’s on Hall (1959)

E N D
Polychronic Tendency Models: A Gender Contrast Study by Jay D. Lindquist Western Michigan University and Carol F. Kaufman-Scarborough Rutgers University
Introduction • Polychronic and monochronic behavior (time use) • Studies from the 1950’s on • Hall (1959) • Economic resource (1970’s – early 1990’s) • Working women juggling work, social, marketplace, and family demands (1980’s on) • Polychronic scale development begins (late 1980’s) • The Polychronic Attitude Index (PAI) (1991)
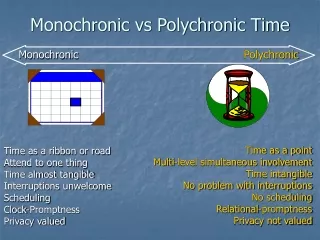
Polychronic – MonochronicChronological Background • Hall’s conceptualization • Economic resource and fixed time budget approach • Time pressure and convenience impact
Polychronic – MonochronicChronological Background • Direct and indirect measures • F-A-S-T Scale • Time Dimension Scales • Time Structure Questionnaire • Time Management Behavior Scale • Polychronic Attitude Index
Polychronic – MonochronicChronological Background • Multidisciplinary Constructs • Modified PAI (PAI3) • Inventory of Polychronic Values (IPV)
Research Directions • Simultaneous Multiple Activity • Activity changing behavior • What are “activities” • Need for new models
The Study • Objectives – develop and compare gender-specific models of polychronic tendency • Hypothesis 1 – models will consist of both SMA and AC items
The Study • Hypothesis 2 – the two gender-specific models will differ from one another
Methodology • Phase I • N = 257 adults (f = 118, m = 139) • Develop pool of potential SMA and AC items • Assure respondents have same “activities” understanding (physically active, mentally active, monitoring, and eye/ear attention)
Item Pool • SMA items • JUGLTWO, SHTRYTWO, COMFTWO, TRYTWO, DOTWO, ENJOYTWO, ENERGTWO, EFFICTWO, EFFECTWO, APROVTWO • AC items • CHGMORE, COMFCHG, ENJOYCHG, ENERGCHG, EFFICCHG, EFFECCHG, APROVCHG
Methodology • Phase II • N = 386 adults (f = 219, m = 167) • Develop best fit, parsimonious gender-specific models • Compare models
Items in “Best Fit” Models • SMA – Women • JUGLTWO, SHTRYTWO, COMFTWO, ENJOYTWO and EFFICTWO • SMA – Men • JUGLTWO, SHTRYTWO, COMFTWO, and DOTWO
Items in “Best Fit” Models • AC – Women • CHGMORE and COMFCHG • AC – Men • ENERGCHG, EFFECCHG and APROVCHG
Conclusions • Hypothesis 1 – Accepted • “Best fit” gender-specific models of polychronic tendency include both SMA and AC items • Hypothesis 2 – Accepted • Gender-specific models of polychronic tendency are different
Discussion • SMA items JUGLTWO and COMFTWO part of PAI scale • SMA items JUGLTWO, SHTRYTWO and COMFTWO part of both models • No AC items in common across two models
Discussion • Ratio of SMA to AC items: women (4 to 3), men (5 to 2) • Affective items (JUGLTWO, COMFTWO, ENJOYTWO, COMFCHG) ratio women to men is 4 to 2 • CHGMORE only shows in women’s model
Discussion • Perceived outcome items (EFFICTWO, ENERGTWO, EFFECCHG, APROVCHG) ratio women to men is 1 to 3 • Scale ranges and means: women (12 to 49, 36.4); men (7 to 49, 34.8); n = 198 (women); n = 150 (men); midpoints 30.5/28 (w/m)
Implications • Limitations • No social desirability check • No discriminant, convergent or nomological validity checks • General, not situation-specific models • Tests needed to show practical marketplace applications