Download
1 / 10
100 likes | 152 Views
Explore observations of saturated thickness in GMD 4 Counties with detailed charts showcasing trends in well saturation levels and decline rates over time. The data also highlights average thickness and total observation wells per County.

E N D
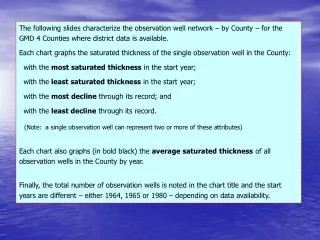
The following slides characterize the observation well network – by County – for the GMD 4 Counties where district data is available. Each chart graphs the saturated thickness of the single observation well in the County: with the most saturated thickness in the start year; with the least saturated thickness in the start year; with the most decline through its record; and with the least decline through its record. (Note: a single observation well can represent two or more of these attributes) Each chart also graphs (in bold black) the average saturated thickness of all observation wells in the County by year. Finally, the total number of observation wells is noted in the chart title and the start years are different – either 1964, 1965 or 1980 – depending on data availability.