Download
1 / 70
700 likes | 803 Views
Josh Nassar Overview of Mortgage Market: How We Got Here and Policy Responses July 23, 2008 Foreclosure Community Impact Summit Greater Richmond Convention Center, Richmond, VA. Introduction. About CRL.

E N D
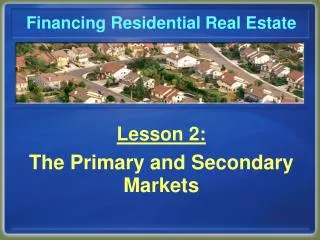
Josh Nassar Overview of Mortgage Market: How We Got Here and Policy Responses July 23, 2008 Foreclosure Community Impact Summit Greater Richmond Convention Center, Richmond, VA
About CRL • Nonprofit, nonpartisan research and policy organization dedicated to protecting homeownership and family wealth by working to eliminate abusive financial practices. • Affiliated with Self-Help, one of the nation’s largest community development financial institutions.
Self-Help • Self-Help is a non-profit lender founded in 1980 to increase and protect wealth and ownership opportunities for minorities, women, rural residents, and low-wealth families • Over $5 billion in home, small business and non-profit financing for more than 55,000 loans in 47 states and the District of Columbia • Serves borrowers who do not meet traditional underwriting criteria • 7 branches in NC plus a Washington, DC and Oakland, CA branch
Home Equity and Wealth • Wide gaps remain in wealth and homeownership • In 2004, the median net worth of households of color was only 17.6% of the median net worth of white households. (Federal Reserve Bulletin, Feb. 2006) • Approximately 75% of white Americans own their homes. The figures are much lower for African-Americans (48.2%) and Latinos (49.5%). (US Census Housing Vacancy Survey, 2005) • Promoting homeownership for remains the most important tool for closing the wealth gap.
Home Equity and Wealth Median value of home equity as share of the net worth of homeowner households (2002) Source: Rakesh Kochkar, The Wealth of Hispanic Households: 1996 to 2002 at 5, tbl. 1 (Pew Hispanic Center, 2004).
Prime v. Subprime • “Prime” Borrowers • Excellent credit history; stable employment history; meet traditional debt-to-income, payment-to-income, and loan-to-value ratio underwriting criteria • “Subprime” Borrowers • Credit blemishes (usually, less than “A” rating); insufficient or non-traditional credit history; less stable employment history; high debt-to-income, payment-to-income, or loan-to-value ratios
More Costly Credit • Subprime loans are priced higher, in theory to cover higher risk • However, many subprime borrowers could qualify for prime loans but are courted only by subprime lenders • Other subprime borrowers are charged more than is justified by risk. Origination fees are typically higher and prepayment penalties are more common
Subprime Market Is Not Fair or Price Competitive • More than 70% of subprime home loans contain prepayment penalties – can cost families thousands of dollars when they refinance or pay off their loans early • Prepayment penalties do not result in lower interest rates – simply another method of stripping home equity • Yield spread premiums encourage brokers to make loans at interest rates higher than the rates for which borrowers qualify.
A Critical Issue “ . . . [B]ecause of the concentration of subprime lending in low-income and black neighborhoods, there has been a growing concern that borrowers in these neighborhoods are vulnerable to a subset of subprime lenders, who engage in abusive lending practices, strip borrowers’ home equity, and place them at increased risk for foreclosure.” Randall M. Scheessele, Black and White Disparities in Subprime Mortgage Refinance Lending (U.S. Dept. of Housing and Urban Development, April 2002), at 1.
Losing Ground: Foreclosures in the Subprime Market and Their Cost to Homeowners In one of the worst foreclosure crises in American history, subprime mortgages originated from 1998 through third quarter of 2006 will wipe out $164 billion in homeownership wealth for 2.2 million American families. Research from the Center for Responsible Lending—the first comprehensive, nationwide look at how subprime mortgages perform—shows:
Alarming Rate of Home Losses: For subprime loans made during the past two years: one out of five (19%) will fail. • Worse than Oil Patch: These rates are far worse than the notoriously high rate of foreclosures during the Oil Patch disaster (14 percent) of the 1980s. • Increasing in Most Areas: As the housing market cools, subprime foreclosure rates will rise sharply in most major markets.
Driven by Lending Practices: Subprime lenders are breeding foreclosures through bad underwriting combined with risky loans featuring adjustable rates, balloons, prepayment penalties, low-doc/no-doc. Pervasive 2/28s (“exploding” ARMs) dominate the current market and are very likely to make the loan unaffordable.
Example of 2-28, $200,000 ARM, No Change in Rates Source: CRL Calculations
How Did We Get Here? • Underwriting without regard for ability to repay: • e.g. exploding ARMs, no docs, piggybacks • No escrow for taxes or insurance • Presumption of continued housing appreciation
Most Vulnerable Bear the Brunt: African American and Latino families get a disproportionate share of subprime loans. Low-wealth families have the most to gain from homeownership, and the most to lose from foreclosure. It typically takes 10 years to recover and buy another house – many never recover.
Subprime Spillover: Key Findings • We project that, nationally, foreclosures on subprime home loans originated in 2005 and 2006 will have the following impact on neighborhoods and communities in which they occur: • 40.6 million neighboring homes will experience devaluation because of subprime foreclosures that take place nearby. • The total decline in house values and tax base from nearby foreclosures will be $202 billion • Homeowners living near foreclosed properties will see their property values decrease $5,000 on average.
Impact of the Subprime Collapse • Foreclosures: - 2.2 million subprime loans will have ended in foreclosure - 1 in 5 recent originations will end in foreclose - Disproportionate impact on minority borrowers and communities - Homeowners, not investors • Cost: - $164 billion direct equity loss to borrowers - Billions in equity loss to surrounding homeowners - Costs to lenders, local governments - Impact on national and global economies
Impact of the Subprime Collapse Projected Foreclosures: Loans Originated 1998-2001
Impact of the Subprime Collapse Projected Foreclosures: Loans Originated 2006
Loan Features Carry Risk • Among subprime loans originated in 2000, after controlling for credit score: • ARMs had 72% greater risk of foreclosure than FRM. • Balloons had 36% greater risk than FRM. • Prepayment penalties associated with 52% greater risk. • Low/no doc loans with 29% greater risk. • Purchase money with 29% greater risk than refinance.
Higher-Cost Home Loan Purpose Source: 2006 HMDA: First Lien, Owner-Occupied Conventional Mortgages
Higher cost 1st lien total loans2006 HMDA # Higher cost % of total • African American 411,040 52.5% • Latino 467,373 40.8% • White 1,205,720 22.5% Source: 2006 HMDA: First Lien, Owner-Occupied Conventional Mortgages
Higher cost 1st lien refi loans 2006 HMDA # Higher cost % of total • African American 216,151 52.5% • Latino 200,405 37.2% • White 684,624 26.0% Source: 2006 HMDA: First Lien, Owner-Occupied Conventional Mortgages
Higher cost 1st lien purchase loans2006 HMDA # Higher cost % of total • African American 176,930 52.8% • Latino 250,941 45.0% • White 458,098 18.4% Source: 2006 HMDA: First Lien, Owner-Occupied Conventional Mortgages
Payment Option ARM’sThe Next Wave of Payment Shocks Another complex product that has put many low-income families at risk is the payment option adjustable-rate mortgage (POARM): This product allows people to make monthly payments that do not cover principal and interest, which means that the home experiences “negative amortization” – that is, the principal balance of the loan grows larger – during the period that the minimum payment is being made. Unfortunately, lenders like Countrywide offered these loans to borrowers for whom they were not suited, structured the products so that the payments substantially increase in five years or less when they hit their negative amortization cap, used excessive teaser rates, and failed to document income. Unlike 2/28s, the POARMs that were poorly underwritten are largely Alt-A mortgages as opposed to subprime.
Payment Option ARM’sThe Next Wave of Payment Shocks The next wave of mortgage defaults will likely result from the widespread use of a nontraditional mortgage product known as payment-option adjustable-rate mortgages, or Payment Option ARMs (POARMs). These complicated financial products, which can lead to increased debt and dramatic payment shocks, have largely been overshadowed by the collapse of the subprime market. However, because of the dangerous structure of POARMs and their prevalence in certain markets, these mortgages are likely to exacerbate the housing crisis over the next few years.
Payment Option ARM’sThe Next Wave of Payment Shocks Double Whammy: Negative Amortization + Interest Rate Shock Unlike traditional fixed-rate mortgages, which require borrowers to pay a set amount that covers both accumulated monthly interest and a portion of the loan principal so that the loan is paid down each month, POARMs can actually lead to an increase in the loan balance over time, leaving borrowers with greater debt than they initially took on. These loans are particularly pernicious because they usually start off with a very low “teaser rate” that quickly resets to a much higher rate. This rate reset, combined with a growing loan balance, often results in an unaffordable payment shock for borrowers.
Payment Option ARM’sThe Next Wave of Payment Shocks Negative Amortization Whereas traditional fixed-rate loans are structured so that borrowers pay a fixed amount each month that guarantees a decrease in the amount owed over time, POARMs do not. Generally speaking, each month POARMs allow borrowers to pay the fully-amortizing payment amount (i.e. interest plus principal), an amount equal only to the interest owed, or a minimum payment that is actually less than the accumulated monthly interest. Because of this third option, POARMs can, and often do, actually lead to an increase in the balance of the loan or “negative amortization.” That is, these loans are structured in such a way that borrowers may become increasingly in debt over time. Though there generally is a limit on how high the loan balance can go, once this limit is hit borrowers lose payment options and face dramatic increases in monthly payments.
Payment Option ARM’sThe Next Wave of Payment Shocks Interest Rate Shock As an added danger, these loans often start out with a very low initial “teaser rate”—from one to three percent—which are in effect for a short time In fact, this low starting interest rate can be in effect for as little as one day to one month, after which the interest rate resets (usually to seven to nine percent) and changes monthly. The combination of an adjustable interest rate with a growing loan balance owed can lead to severe payment shocks to borrowers.
Subprime production in the fourth quarter of 2007 was less than half that of the previous quarter, which in turn produced half of the volume of the quarter before it. • According to Inside B&C Lending, an estimated 192.5 billion is subprime mortgages were originated in 2007. That was down a stunning 67.9 percent from the previous year. And lenders originated a paltry $13.5 billion in subprime mortgages in the fourth quarter of 2007, the lowest quarterly production on a record.
FHA endorsement volume outpaced subprime originations in the fourth quarter of 2007 for the first time since 2001. • Seven of the top 20 subprime lenders in 2007 had zero subprime originations in the fourth quarter, either because they abandoned the products voluntarily or because they were out of business • The subprime share of total MBS issuance fell to a dismal 3.5 percent in the fourth quarter of 2007, according to the Inside Mortgage Finance MBS Database. That’s well below the sector’s 21.6 percent share for 2005.
Loan Modification • Very few homeowners who cannot pay their mortgages will be able to sell or refinance. • Loan servicers who could modify loans to make them more affordable aren’t doing so in sufficient numbers: A recent report by Moody’s Investors Service (focusing on Jan-Mar 2008) found that loan servicers had only modified 9.8 percent of mortgages that increased to higher rates, while the Dec 2007 survey reported only 3.5 percent. (The survey includes information from ten servicers with a total servicing volume of approximately $550 billion. These servicers constitute about 50% of the total US subprime servicing market)
The Moody’s survey also reports that: • There has been a relatively high rate of re-defaults on loans that were modified in 2007. The survey finds 42% of loans that were modified in the first half of 2007 were 90+ days delinquent as of March 31, 2008. • Servicers continue to be extremely challenged by the unprecedented level of delinquencies and reduction in profitability.
Local Impact of Foreclosure Crisis Virginia Subprime Foreclosure Starts: 2003-2007
Snapshot of Housing Market’s Distressing Trends Based on HOPE NOW numbers recently released and the most recent Mortgage Bankers Association’s National Delinquency Survey, released last month • Seriously delinquent loans are at a record high for both prime and subprime loans. • The MBA survey shows over 16 percent of subprime loans were "seriously delinquent," that is 90-days or more delinquent or in foreclosure, at the end of March. This is double the 8 percent rate from one year earlier and the highest on record. • Furthermore, though defaults on subprime loans continue to drive the overall housing crisis, prime loans are also faltering, with the percent of seriously delinquent prime loans more than doubling from a year earlier.
Snapshot of Housing Market’s Distressing Trends • The number of borrowers who lost their homes to foreclosure soared in May. • HOPE NOW estimates that 85,000 families lost their homes to foreclosure in May, the highest one-month figure since the inception of the program. This represents a 35 percent increase over three months and more than double the number from July of last year. • The total number of foreclosures since the program began last July is now estimated at almost 650,000.
Snapshot of Housing Market’s Distressing Trends • The number of borrowers who received loan modifications is small compared to the number who lost their home or who are in danger of losing their home. • While HOPE NOW reported 276,000 loans either entered or completed foreclosure in May, only 70,000 received loan modifications during the month. That is, almost four times as many families lost their home or are in the process of losing their home as received loan modifications from servicers. • Furthermore, the data provided by HOPE NOW understates the number of loans in foreclosure, as it only includes those homes that entered foreclosure and those that completed foreclosure during the month, not the total number currently in the foreclosure process. In fact, 1.1 million families were in foreclosure at the end of March.
Snapshot of Housing Market’s Distressing Trends • The number of families in danger of losing their homes continues to be near record highs. • According to the data released by HOPE NOW, an estimated 1,977,000 loans were 60-days or more delinquent or entered foreclosure in May, the second highest number since the program began reporting data last July. This is an astonishing 43 percent increase since July of last year. This trend is consistent with the new MBA study, which shows that more than 5 percent of all loans were at least 60-days delinquent or in foreclosure at the end of the first quarter of 2008, compared to just over 3 percent a year earlier.
The numbers show the problem is getting worse. And the fact is that nothing is known about the effectiveness of the loan modifications or workouts that are being provided by servicers. HOPE NOW gives little information on the types of modifications being completed by industry or on the performance of those newly modified loans. HOPE NOW's data provides little insight into whether its' members efforts are resulting in long-term, sustainable solutions for homeowners.
Addressing the Foreclosure Crisis Court-Supervised Loan Modifications – Prevent the Most Damage Emergency Home Ownership and Mortgage Equity Protection Act (HR 3609); Helping Families Save Their Homes in Bankruptcy Act of 2007 (S 2136) We could prevent up to 600,000 foreclosures by allowing courts to supervise loan modifications, effectively mediating between lenders and homeowners. To do this, we don't need any public funding or a new bureaucracy—we can use the existing bankruptcy court system, which allows borrowers to modify all debts except loans against their personal residence. The remedy in HR 3609/S2136 would apply only to people who are now holding subprime or nontraditional loans and who are truly desperate, about to lose their house. This proposal has passed both House and Senate Judiciary Committees and attracted bipartisan support (13 co-sponsors in the Senate and 86 in the House), but so far industry opposition has been successful in preventing this solution from moving forward.
The Impact of Court-Supervised Modifications on Subprime Foreclosures in Virginia Expected benefit of court-supervised modifications for Virginia families
Addressing the Foreclosure Crisis:H.R. 6076, Rep. Matsui (D-CA) Foreclosure Deferment – Give Homeowners More Time Home Retention and Economic Stabilization Act (HR 6076) This bill would allow struggling homeowners who meet certain criteria to delay a foreclosure sale by up to nine months, so long as they make reasonable monthly mortgage payment to their lender and maintain the property responsibly. Only subprime mortgages and mortgages with negative amortization are eligible. The proposed timeout would benefit homeowners and industry in several ways: (1) Allows more time for homeowners to seek a solution through a loan modification, refinance, or home sale (2) more time for servicers to work with troubled homeowners (3) more time for new programs, such as an FHA expansion, to be implemented.