
Optimizing Signal Processing Accuracy with Independent Component Analysis (ICA)
Independent Component Analysis (ICA) is a feature extraction method for blind source separation, aiming to find linearly independent signals. This technique, akin to solving the cocktail party problem, enhances the accuracy of signal processing. Explore ICA's impact on classifiers like Decision Trees, LDA, and Naïve Bayes. Consider future research avenues, such as diverse classifier error rates and blind source separation forms. Evaluate ICA effectiveness with robust classifiers and assess efficiency in measuring its impact. Implement ICA in real-time scenarios for practical applications. Conclude with a 10-fold cross-validation approach and insights from using Naïve Bayes for classification accuracy.

Optimizing Signal Processing Accuracy with Independent Component Analysis (ICA)
E N D
Presentation Transcript
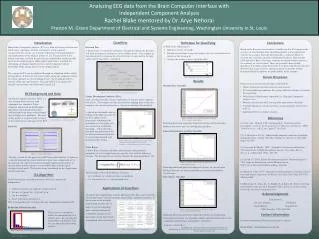
Independent Component Analysis (ICA) is a form of feature extraction and blind source separation. Feature extraction is a step in pattern classification that creates a new feature subset based on transformations and combinations of the original feature set [1]. The goal of ICA for feature extraction is to find the most linearly independent signals possible based on the original signal. Blind source separation is a method for calculating an original signal based on a mixed signal and with no knowledge of the mixing process or the original signal. The concept of ICA can be explained through an adaptation of the cocktail party problem. If there are two conversations going on in opposite corners of a room and there are two recording devices, the recordings will be a mixture of the two conversations. The goal of ICA is to separate the original conversations out of the mixed signals [2]. Technique for Classifying Thank you to: Dr. AryeNehorai Ed Richter Chuck HolmesXiaoxiaoXu NSF Grant No. CCF-1014908 Acknowledgments [1] Jain, A.K.; Duin, R. P W; Jianchang Mao, "Statistical pattern recognition: a review," Pattern Analysis and Machine Intelligence, IEEE Transactions on , vol.22, no.1, pp.4,37, Jan 2000 [2] A. Hyvärinen; E. Oja, “Independent component analysis: algorithms and applications”, Neural Networks, Volume 13, Issues 4–5, June 2000, Pages 411-430 [3] SreeramaK. Murthy. 1998. “Automatic Construction of Decision Trees from Data: A Multi-Disciplinary Survey”.Data Min. Knowl. Discov. 2, 4 (December 1998), 345-389. [4] Sayad, S. (2010). Linear Discriminant Analysis. Retrieved April 16, 2013, from An Introduction to Data Mining website: http://www.saedsayad.com/data_mining_map.htm [5] Mitchell, T. M. (1997). Generative and discriminative classifiers: Naive bayesand logistic regression. In Machine Learning. New York, NY, USA: McGraw-Hill. [6] Borovicka, T., Jirina, M., Jr., Kordik, P., & Jirina, M. (2012). Selecting representative data sets. In A. Karahoca (Ed.), Advances in data mining knowledge discovery and applications. References Based on the decision tree classifier it would seem that ICA improves the accuracy of classification when the dimensionality is not reduced and worsens the accuracy when the dimensionality is reduced. However, decision tree classifiers are often suboptimal classifiers. Based on the LDA and Naïve Bayes classifiers, reducing the dimensionality increases the accuracy of classification. These are generally more reliable classifiers so I would accept these results over those from the decision tree. However, this is not extensive enough research to conclude without hesitation that ICA improves the predictability of the stimulus. Introduction Results Decision Tree Classifier Classifiers Decision Tree A decision tree is recursively created by selecting the split in the data that will lead to the purest sub-datasets in the children nodes. Test samples are then classified by comparing the selected feature at each node to the split values until a leaf node is reached [3]. ICA Algorithm The Brain Computer Interface (BCI) is a way of using brain waves to send commands to a computer. It has important application for handicapped individuals and individuals that have suffered from brain injury who no longer have full physical capabilities. The goal of this project is to increase the accuracy of the signals processing stage of the BCI. Goal is to maximize the non-gaussianity which is a measure of independence. Choose an initial (e.g. random) weight vector w. Let w+ = E{xg(wTx)}−E{g0(wTx)}w Let w = w+/||w+|| If not converged, go back to 2. This is an algorithm for extracting only one independent component [2]. Future areas of research for this topic could include: Other criterion for classifier error rate and accuracy ICA under differing conditions like using a different function to estimate the negentropy Other forms of blind source separation (i.e. Principal Component Analysis, etc.) Measure effectiveness of ICA using other, more robust classifiers Consider efficiency as well as accuracy in measuring the effectiveness of IC A Implement ICA in an online scenario Conclusions 10-Fold Cross Validation [6] Split data set into 10 groups Perform classification using each group as the test set and the rest of the data as the training set Average the accuracy across all of the folds Naïve Bayes A Naïve Bayes classifier calculates and maximizes the posteriori probability of a test sample being in a specific class with the following formula. The training data are used to calculate the prior probabilities [5]: This formulas is derived with Bayes’ Theorem. Aj = attributes, aj = observed values of attributes C = the actual class, cj = the predicted class Reducing dimension positively impacted accuracy of classification. Problem: Results vary greatly depending on chosen threshold for classification I selected my threshold value by looking at the LDA classifier for the ICA signal with 14 dimensions and plotting the probability of classifying each class incorrectly at different thresholds. I then selected a threshold that performed well for both but minimized the risk of classifying imagined right hand movement wrong. Reducing dimension positively impacted accuracy of classification. Naïve Bayes Classifier is a generally reliable and efficient classifier if the conditional independence assumption is not broken. ICA is used as a method to reduce the dimensionality of a feature space. By selecting the eigenvalues with highest value one can select the most salient features. Linear Discriminant Analysis (LDA) LDA classification finds a linear combination of features which separates two classes. Test samples are then classified by mapping them to the class boundary and classifying based on a selected or calculated threshold [4]. Data Set Reducing dimension negatively impacted accuracy of classification. Problem: Decisions trees are sub-optimal classifiers Applications of Classifiers BCI Background and Data Future Directions Preston M. Green Department of Electrical and Systems Engineering, Washington University in St. Louis Rachel Blake mentored by Dr. AryeNehorai Analyzing EEG data from the Brain Computer Interface with Independent Component Analysis Figure 6: Example of 10-fold cross validation Figure 4: Part of decision tree used in classifying ICA signals Figure 7: Accuracy of decision tree classifier for different levels of dimensionality reduction. Figure 1: The flow of the signal in a BCI. Linear Discriminant Analysis Classifier Figure 5: ROC curve comparing the probability of false classification of right hand movement and the probability of false classification of another stimulus. Figure 2: Original 14 EEG signals. The data set used for this project was EEG data collected from 14 nodes on a subjects head and this makes the feature space have a dimension of 14. In each trial, the subject was asked to imagine right hand movement at specific times and this stimulus was recorded along with the signal recorded at each node. The features being considered are the signals from the different nodes. Figure 8: Accuracy of LDA classifier for different levels of dimensionality reduction. Naïve Bayes Classifier Classifiers have applications in many different fields. They can be used for classifying images, sounds, language, handwriting, and human features. It has becomean increasingly studied field recently due to higher levels of computing power and the widespread availability of large sets of data which can be more easily manipulated withclassifiers [1]. Reduction of Dimensionality Figure 9: Accuracy of Naïve Bayes classifier for different levels of dimensionality reduction. Contact Information For more information about this project please contact: Rachel Blake – RachelcBlake@wustl.edu Accuracy calculated as: Table 1: Possible applications of classifiers [1] Figure 3: Eigenvalues used for reducing dimensionality


