Download
1 / 48
480 likes | 611 Views
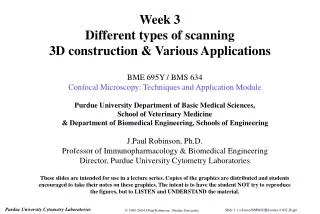
Week 3 Different types of scanning 3D construction & Various Applications.

E N D
Week 3 Different types of scanning 3D construction & Various Applications BME 695Y / BMS 634 Confocal Microscopy: Techniques and Application ModulePurdue University Department of Basic Medical Sciences, School of Veterinary Medicine& Department of Biomedical Engineering, Schools of EngineeringJ.Paul Robinson, Ph.D.Professor of Immunopharmacology & Biomedical EngineeringDirector, Purdue University Cytometry Laboratories These slides are intended for use in a lecture series. Copies of the graphics are distributed and students encouraged to take their notes on these graphics. The intent is to have the student NOT try to reproduce the figures, but to LISTEN and UNDERSTAND the material.
Lecture summary 1. Line scanning confocal microscopy 2. Slit formation 3. Light sources, advantages and disadvantages 4. 4D confocal imaging 5. Applications of Confocal Microscopy
DVC Linescanner CCD Camera Emission Filters Fiber Optic Link Computer Laser Scanhead ocular
DVC 250 Line Scanner scanning mirror Laser Slit Ocular Filters Lens Lens “galvanometer” descanning mirrors Specimen
Stationary Slit Apertures • Illuminated line must be scanned over specimen • Emitted light must be descanned • Light passing through slit must be rescanned to reconstruct a 2D image on the retina
Scanning • The scanning is performed by oscillating mirrors • Rate of oscillation is 25-30 Hz
Mirrors • DVC uses mirrors, not lenses • Reduces chromatic aberration
Slit • The confocal slit is variable • Smallest size is 20 um • Images of excellent resolution can be collected using video cameras using small slit width
Laser spot to line Beam splitting lens Laser in Laser out
How the laser scans Scan width can be adjusted
Light Sources - Lasers • Argon Ar 488-514 nm • Krypton-Ar Kr-Ar 488 - 568 - 647 nm • Helium-Neon He-Ne 633
Light Sources • Kr-Ar lasers most common (488, 568, 647 nm) • Ar - large (100-200 mW) • Coupled to head with single mode optical fiber (these preserve coherence) • Fibers usually have 60% efficiency • Light is spread over specimen not at point so 25 mW laser produces 3-5 mW at specimen
Main Advantages • Can follow very rapid events • Up to 30 frames per second • Best when searching over large specimens for specific features • For thick specimens provides an intermediate image between fluorescence microscopy and point scanners • Systems are small • Can be easily changed from upright to inverted scopes • Very low level light imaging
Disadvantages • Need higher power lasers because point is spread over line • Can bleach specimens significantly • Much high precision in slit manufacture (increase in $) • Must use camera to detect signal • Harder to use UV • Cost is significant relative to point scanners
Image collection • CCD Camera (usually cooled) • Faster - cooled and intensified camera
4D confocal microscopy • Time vs 3D sections • Used when evaluating kinetic changes in tissue or cells • Requires fast 3D sectioning • Difficult to evaluate
4D Imaging Time 1 2 3 4 5 Fluorescence Time
4D Imaging Time 1 2 3 4 5
4D Imaging Time 1 2 3 4 5 This could also be achieved using an X-Z scan on a point scanner.
Software • Image analysis • Universal Imaging “Metamorph” • Image Pro-Plus • NIH Image • Fluorescence Ratioing “Metafluor”
Methods for visualization • Hidden object removal • Easiest methods is to reconstruct from back to front • Local Projections • Reference height above threshold • Local maximum intensity • Height at maximum intensity + Local Kalman Av. • Height at first intensity + Offset Local Ht. Intensity • Artificial lighting • Artificial lighting reflection
Software available • SGI - VoxelView • MAC - NIH Image • PC • Optimus • Microvoxel • Lasersharp • Confocal Assistant
Differential Interference Contrast(DIC) (Nomarski) Visible light detector Polarizer 1st Wollaston Prism DIC Condenser Specimen Objective 2nd Wollaston Prism Analyzer Light path
Confocal Microscopy in the Research Laboratory • Applications • Live Cell studies • Time Lapse videos • Exotic applications
Applications Cellular Function • Esterase Activity • Oxidation Reactions • Intracellular pH • Intracellular Calcium • Phagocytosis & Internalization • Apoptosis • Membrane Potential • Cell-cell Communication (Gap Junctions)
Applications Probe Ratioing • Calcium Flux (Indo-1, Fluo-3) • pH indicators (BCECF, SNARF) Molecule-probe Excitation Emission Calcium - Indo-1 351 nm 405, >460 nm Magnesium - Mag-Indo-1 351 nm 405, >460 nm Calcium-Fluo-3 488 nm 525 nm Calcium - Fura-2 363 nm >500 nm Calcium - Calcium Green 488 nm 515 nm Phospholipase A - Acyl Pyrene 351 nm 405, >460 nm
Exotic Applications • Release of “Caged” compounds • FRAP (UV line) • Lipid Peroxidation (Paranaric Acid) • Membrane Fluidity (DPH)
“Caged” Photoactivatable Probes Nitrophenyl blocking groups e.g. nitrophenyl ethyl ester undergoes photolysis upon exposure to UV light at 340-350 nm • Ca++: Nitr-5 • Ca++ - buffering: Diazo-2 • IP3 • cAMP • cGMP • ATP • ATP--S Examples
Applications Organelle Structure & Function • Mitochondria (Rhodamine 123) • Golgi (C6-NBD-Ceramide) • Actin (NBD-Phaloidin) • Lipid (DPH) • Endoplasmic Reticulum
Applications • Conjugated Antibodies • DNA/RNA • Organelle Structure • Cytochemical Identification • Probe Ratioing
G0-G1 G2-M S # of Events Fluorescence Intensity Flow Cytometry of Apoptotic Cells Apoptotic cells Normal G0/G1 cells # Events PI - Fluorescence
Flow Cytometry of Bacteria: YoYo-1 stained mixture of 70% ethanol fixed E.coli cells and B.subtilis(BG) spores. mixture Scatter Simultaneous In Situ Visualization of Seven Distinct Bacterial Genotypes Confocal laser scanning image of an activated sludge sample after in situ hybridization with 3 labeled probes. Seven distinct, viable populations can be visualized without cultivation. Amann et al.1996. J. of Bacteriology 178:3496-3500. BG BG E.coli E.coli Scatter Fluorescence
GN-4 Cell LineCanine Prostate CancerConjugated Linoleic Acid 200 µM 24 hours 10 µM Hoechst 33342 / PI
Flow-karyotyping of DNA integral fluorescence (FPA) of DAPI-stained pea chromosomes. Inside pictures show sorted chromosomes from regions R1 (I+II) and R2 (VI+III and I), DAPI-stained; from regions R3 (III+IV) and R4 (V+VII) after PRINS labeling for rDNA (chromosomes IV and VII with secondary constriction are labeled) A-B): metaphases of Feulgen-stained pea (Pisum sativum L.) root tip chromosomes (green ex), Standard and reconstructed karyotype L-84, respectively. C) and D): flow-karyotyping histograms of DAPI-stained chromosome suspensions for the Standard and L-84, respectively. Capital letters indicates chromosome specific peaks, as assigned after sorting
Live cell studies Step 1: Cell Culture top view 1 2 Step 2: Cell Wash 3 4 Below: the culture dishes for live cell imaging using a confocal microscope and high NA objectives. 6 5 Step 3: Transfer to Lab-Tek plates 7 8 side view 170 M coverslip Lab-Tek Step 4: Addition of DCFH-DA, Indo-1, or HE stimulant/inhibitoradded 37oheatedstage confocalmicroscope oilimmersion objective
Confocal System Culture System Photos taken in Purdue University Cytometry Labs Photo taken from Nikon promotion material
Example of DIC and Fluorescnece Giardia (DIC image) (no fluorescence) (photo taken from a 35 mm slide and scanned - cells were live when photographed) Human cheek epithelial cells (from JPR!) stained with Hoechst 33342 - wet prep, 20 x objective, 3 x zoom (Bio-Rad 1024 MRC)
Fluorescence Microscope image of Hoechst stained cells (plus DIC) Image collected with a 470T Optronics cooled camera
G0-G1 G2-M S # of Events Fluorescence Intensity Measurement of DNA • Use for DNA content and cell viability • 33342 for viability • Less needed to stain for DNA content than for viability • decrease nonspecific fluorescence • Low laser power decreases CVs
PI - Cell Viability How the assay works: • PI cannot normally cross the cell membrane • If the PI penetrates the cell membrane, it is assumed to be damaged • Cells that are brightly fluorescent with the PI are damaged or dead Viable Cell Damaged Cell PI PI PI PI PI PI PI PI PI PI PI PI PI PI
Flow-karyotyping of DNA integral fluorescence (FPA) of DAPI-stained pea chromosomes. Inside pictures show sorted chromosomes from regions R1 (I+II) and R2 (VI+III and I), DAPI-stained; from regions R3 (III+IV) and R4 (V+VII) after PRINS labeling for rDNA (chromosomes IV and VII with secondary constriction are labeled) A-B): metaphases of Feulgen-stained pea (Pisum sativum L.) root tip chromosomes (green ex), Standard and reconstructed karyotype L-84, respectively. C) and D): flow-karyotyping histograms of DAPI-stained chromosome suspensions for the Standard and L-84, respectively. Capital letters indicates chromosome specific peaks, as assigned after sorting
Confocal Microscope Facility at the School of Biological Sciences which is located within the University of Manchester. These image shows twenty optical sections projected onto one plane after collection. The images are of the human retina stained with Von Willebrands factor (A) and Collagen IV (B). Capturing was carried out using a x16 lens under oil immersion. This study was part of an investigation into the diabetic retina funded by The Guide Dogs for the Blind.
Examples from Bio-Rad web site Paramecium labeled with an anti-tubulin-antibody showing thousands of cilia and internal microtubular structures. Image Courtesy of Ann Fleury, Michel Laurent & Andre Adoutte, Laboratoire de Biologie Cellulaire, Université, Paris-Sud, Cedex France. Whole mount of Zebra Fish larva stained with Acridine Orange, Evans Blue and Eosin. Image Courtesy of Dr. W.B. Amos, Laboratory of Molecular Biology, MRC Cambridge U.K.
Examples from Bio-Rad Web site Projection of 25 optical sections of a triple-labeled rat lslet of Langerhans, acquired with a krypton/argon laser. Image courtesy of T. Clark Brelje, Martin W. Wessendorf and Robert L. Sorenseon, Dept. of Cell Biology and Neuroanatomy, University of Minnesota Medical School. This image shows a maximum brightness projection of Golgi stained neurons.
Confocal Microscope Facility at the School of Biological Sciences which located within the University of Manchester. The above images show a hair folicle (C) and a sebacious gland (D) located on the human scalp. The samples were stained with eosin and captured using the slow scan setting of the confocal. Eosin acts as an embossing stain and so the slow scan function is used to collect as much structural information as possible. References Foreman D, Bagley S, Moore J, Ireland G, Mcleod D, Boulton M 3D analysis of retinal vasculature using immunofluorescent staining and confocal laser scanning microscopy, Br.J.Opthalmol. 80:246-52
SINTEF Unimed NIS Norway http://www.oslo.sintef.no/ecy/7210/confocal/micro_gallery.html The above image shows a x-z section through a metallic lacquer. From this image we see the metallic particles lying about 30 microns below the lacquer surface. The above image shows a x-y section in the same metallic lacquer as the image on the left.
http://www.vaytek.com/ Material from Vaytek Web site The image on the left shows an axial (top) and a lateral view of a single hamster ovary cell. The image was reconstructed from optical sections of actin-stained specimen (confocal fluorescence), using VayTek's VoxBlast software. Image courtesy of Doctors Ian S. Harper, Yuping Yuan, and Shaun Jackson of Monash University, Australia. (see Journal of Biological Chemistry 274:36241-36251, 1999)
Summary • Linescanning allows faster imaging • Usually requires a CCD camera • 4D imaging • Application of fixed cell imaging • Introduction to live cell imaging