Download
1 / 71
710 likes | 816 Views
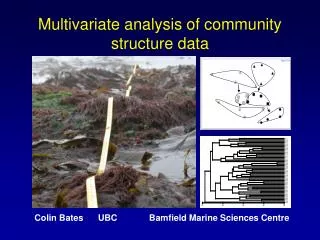
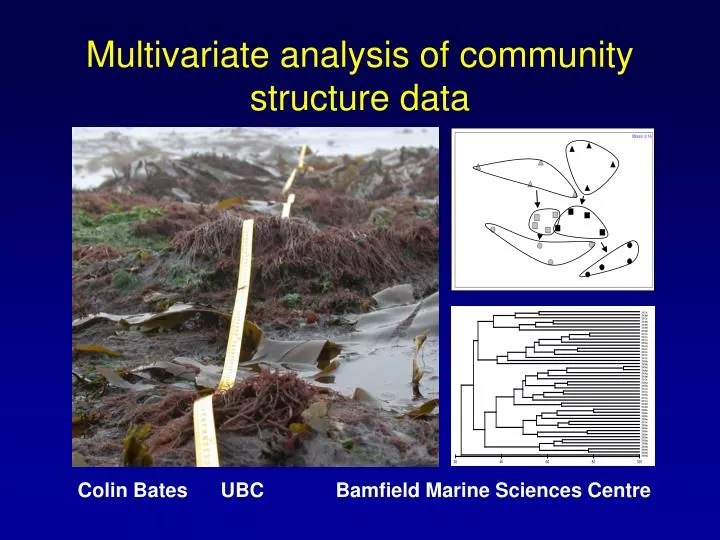
Multivariate analysis of community structure data. Colin Bates UBC Bamfield Marine Sciences Centre. Goals. To understand the ideas behind multivariate community structure analysis. To understand how to perform these analyses in PRIMER.

E N D
Multivariate analysis of community structure data Colin Bates UBC Bamfield Marine Sciences Centre
Goals • To understand the ideas behind multivariate community structure analysis. • To understand how to perform these analyses in PRIMER. • To be prepared to analyse and interpret your class data later today.
What are multivariate statistics? Statistics that allow us to look at how multiple variables change together
What are multivariate statistics? Statistics that allow us to look at how multiple variables change together: EG: How do 50 species in a community react to an environmental perturbation?
What are multivariate statistics? • Statistics that allow us to look at how multiple variables change together: • EG: How do 50 species in a community react to an environmental perturbation? • 50 ANOVAs?
What are multivariate statistics? • Statistics that allow us to look at how multiple variables change together: • EG: How do 50 species in a community react to an environmental perturbation? • 50 ANOVAs? No… • Multivariate stats allow us to “condense” information for simplicity
When might I use this type of analysis? • For a multi-species community, you may wish to: • pull order from complex systems • visualize these patterns • comparisons over time and space • test hypotheses
Example: Seaweed Communities at Cape Beale • Is flora different at two close sites, each exposed to different wave intensity?
2. Data Analysis Step 1: Entering your data into PRIMER
How to analyze this type of data? 1. Diversity indices
How to analyze this type of data? 1. Diversity indices Yet, most diversity indices do not consider species identity…
How to analyze this type of data? 1. Diversity indices Yet, most diversity indices do not consider species identity… Multivariate community structure analyses
b b a a a a b b b b a a c c c c c c Analysis flow samples species sample similarities ordination How? are sites different?
b a a b b a c c c Analysis flow samples species sample similarities ordination Calculate Bray – Curtis Similarity gives a triangular similarity matrix
within within between
b b a a a a b b b b a a c c c c c c Analysis flow samples species sample similarities ordination How? are sites different?
b a a b b a c c c ordination Visualizing similarities Ordination “maps” similarity relationships between samples
nMDS ordination example Distance between points reflects relative similarity!
Nonmetric multidimensional scaling (nMDS) “the future of ordination is in nonmetric multidimensional scaling” – McCune & Grace, 2002 Nonmetric: no axes Multidimensional: represents relationships between multiple variables in two or three dimensions Scaling: the ratio between reality and representation
How does nMDS work? nMDS uses the RANK ORDER of similarity relationships between samples: A1 is closer to A2 than it is to A3
How does nMDS work? Then, nMDS tries to place points in 2 (or 3) dimensional space to represent this ranked order: A3 A1 is closer to A2 than it is to A3 A1 A2
A2 A1 A3 How does nMDS work? Then, nMDS tries to place points in 2 (or 3) dimensional space to represent this ranked order: A1 is closer to A2 than it is to A3
How accurate is the nMDS map? - Sometimes the nMDS can’t represent all relationship accurately - this is reflected by a high STRESS value
How accurate is the nMDS map? - Sometimes the nMDS can’t represent all relationship accurately - this is reflected by a high STRESS value If Stress Value = 0.0 : perfect map 0.1 : decent map 0.2 : ok map 0.3 : don’t bother . . . . . . . . . . . . similarity in sim. matrix . . . . . . . . distance on nMDS
b a a b b a c c c Main points about ordination! • Ordination is a way to visualize how similar your samples are • - nMDS tries to represent visually the rank order within the underlying similarity matrix • all that matters is the relative distance between points. • stress value allows you to estimate ‘quality’ of the nMDS’ sample similarities ordination
b b a a a a b b b b a a c c c c c c Analysis flow samples species sample similarities ordination are sites different?
b b a a a a b b b b a a c c c c c c Analysis flow samples species sample similarities ordination How? are sites different?
Are groups different? Analysis of Similarities – a statistical approach exposed sheltered
Are groups different? Analysis of Similarities – a statistical approach Ho = sites the same Ha = sites are different exposed sheltered
If Ho (sites the same) = true Similarity within = Similarity between
If Ha (sites different) = true Similarity within > Similarity between
(rbetween - rwithin ) R = standardizing factor Are groups different? Analysis of Similarities – a statistical approach